This article is also available in Spanish.
Solana (SOL) is trading above $150 after days of uncertainty and testing the necessary levels. The altcoin is up 13% since last Thursday, showing signs of strength amid market volatility. Now, Solana is only 5% away from a key resistance at $160, a key level it hasn’t crossed since early August. This resistance marks an important point for SOL, as a break above would create a significant bullish move.
Related Reading
Senior analyst and investor Carl Runefelt shared a technical analysis that suggests Solana is forming a bullish pattern. According to his analysis, if SOL breaks above this pattern, it could lead to a major surge and possibly reach a new all-time high. As traders closely monitor this resistance level, the next few days will be crucial in determining Solana’s future price action.
Investors are eager to see if SOL can break through and spark a broader rally or if it will face rejection and enter consolidation phase. With momentum building, Solana’s price movements are at the center of attention in the crypto market.
Solana Analyst Predicts New ATH Soon
Solana is approaching the critical resistance level at $160 after a 4% surge in the past few hours. Analysts and investors have been paying close attention as the entire crypto market bounces back from the local decline, and Solana is now poised to follow this trend.
The cryptocurrency has gained 13% since last Thursday and is 5% away from breaking the key $160 resistance, a level that has not been exceeded since the beginning of August. Growing market optimism is evident across social media, where speculation about Solana’s future price action is rife.
Prominent crypto investor and analyst Carl Runefelt recently shared his technical analysis of Solana on X. In his analysis, Runefelt highlights that Solana is forming a bullish pattern, which may indicate a major explosion if the price breaks above the $160 resistance.
According to Runefelt, Solana’s rise to new all-time highs will be greater if he breaks the upper boundary of this bullish triangle pattern.
The $160 area proved to be a key resistance level, pushing Solana’s price three times since early August. As Solana is approaching this critical level again, many investors are hoping that the price will break through this time, leading to a big rise.
Related Reading
However, failure to break this resistance can cause consolidation, with traders looking for strong confirmation of the next big move.
The coming days will be crucial for Solana, as the market eagerly awaits confirmation of a breakout or further consolidation. If the bulls break above the $160 resistance, it could pave the way for Solana to target a new high, driving renewed interest and momentum in the altcoin price.
SOL Supply Zone Will Be Violated
Solana (SOL) is trading at $153 after a modest move above the 200 daily moving average (MA) at $151. This upward movement marks an important period for SOL, as being above this key indicator is seen as a good sign of potential future gains. If the price can maintain its position above the 1D 200 MA, it could pave the way for a direct push towards the key resistance level of $160.
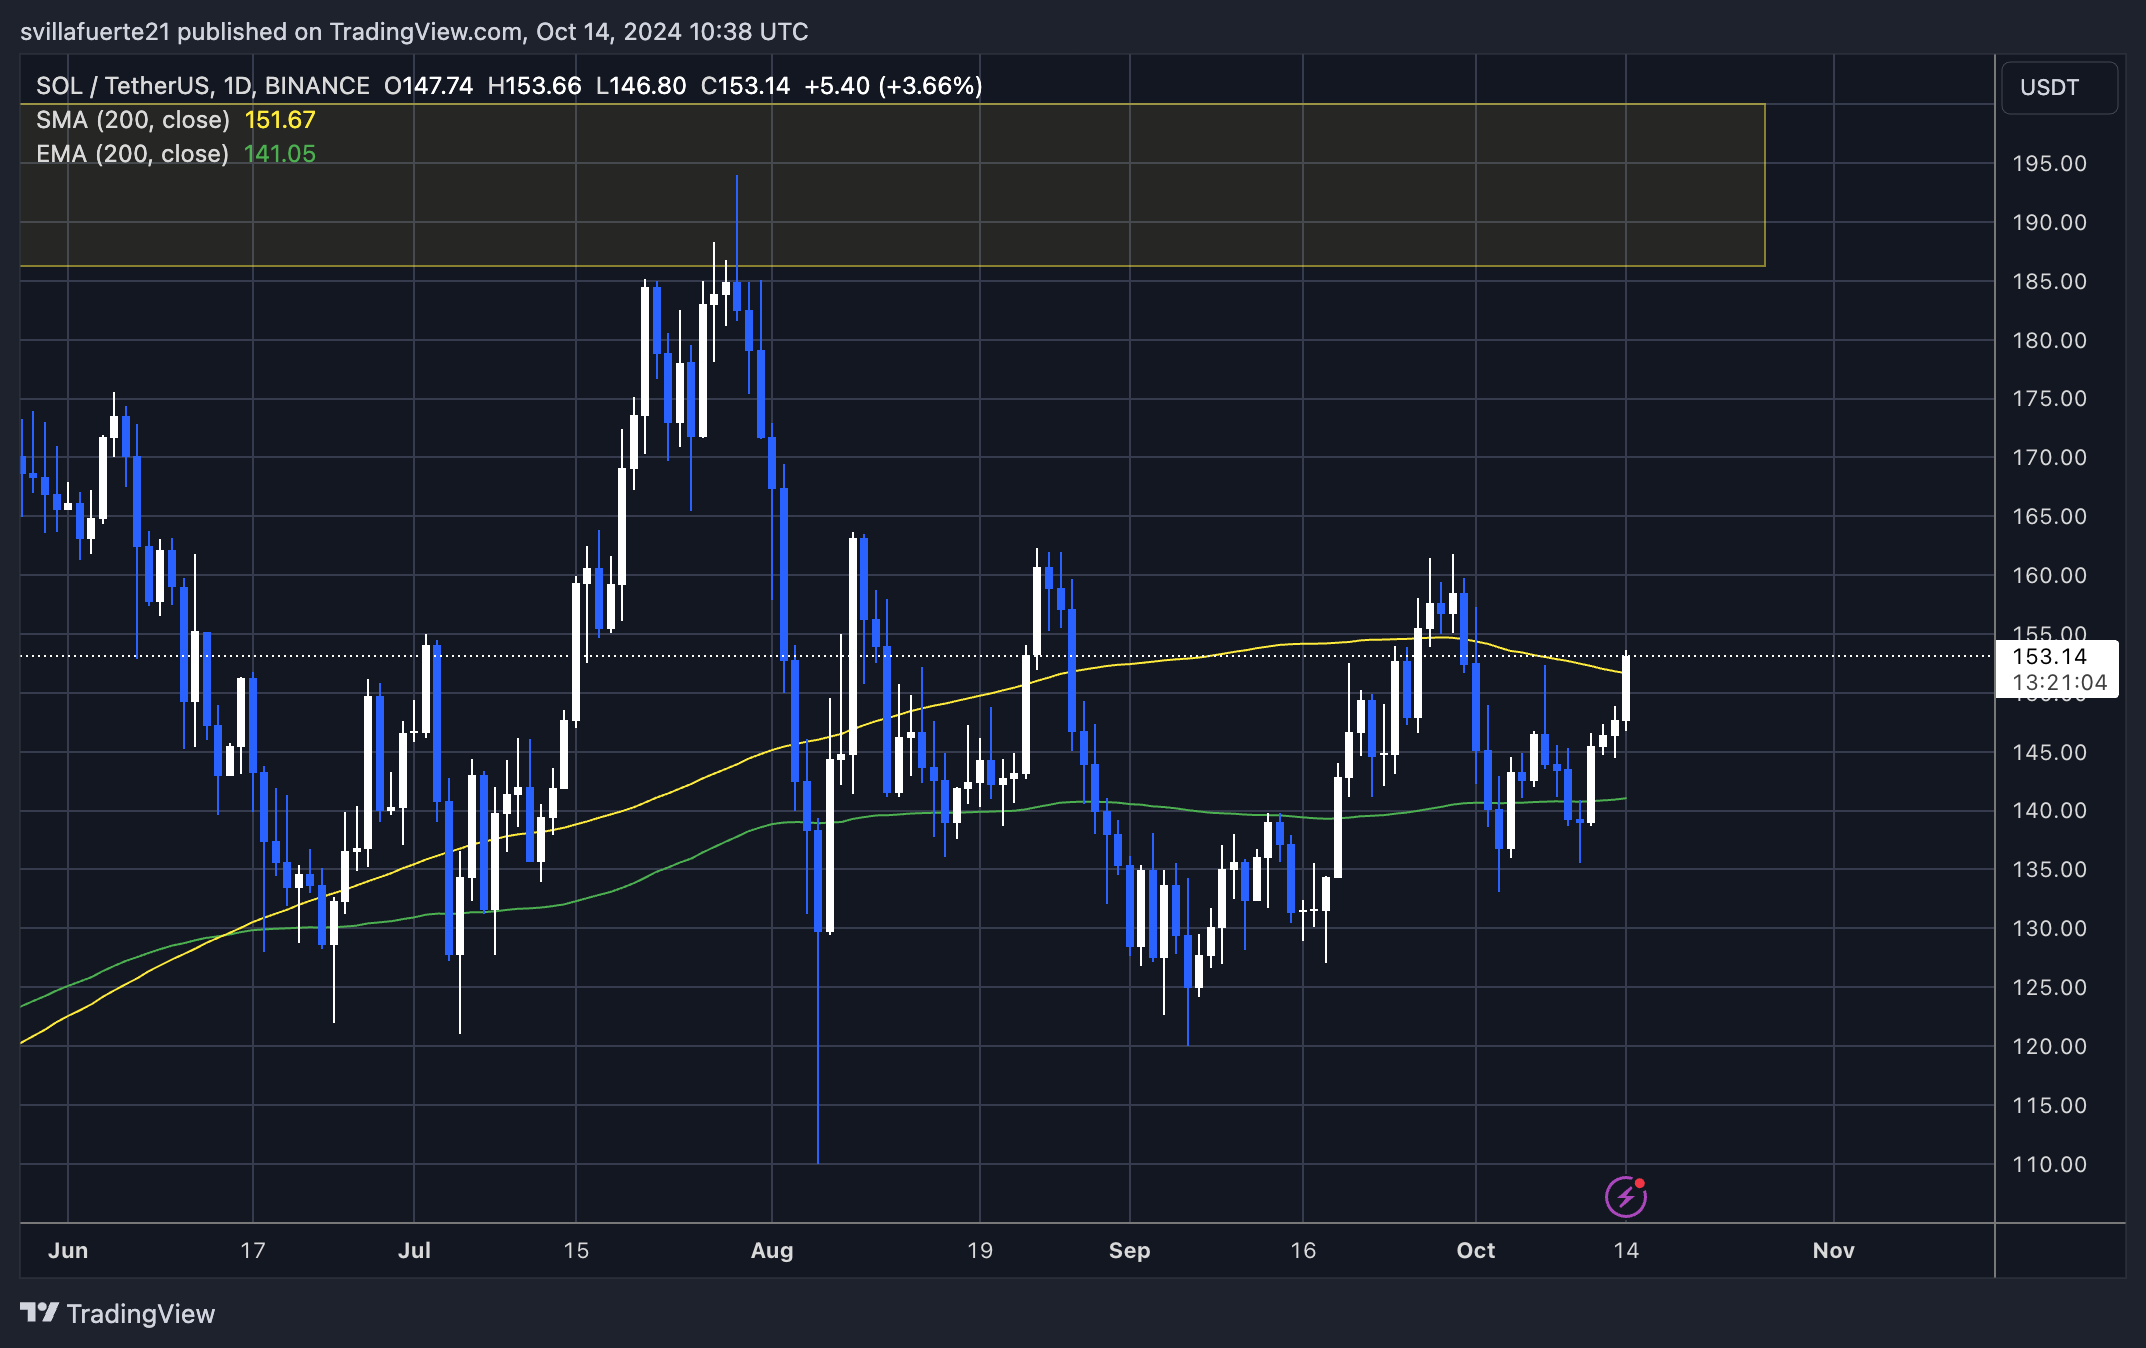
A successful close above $160 would open the door to a challenge to the annual high of around $210, attracting traders and investors looking for momentum in the altcoin. However, if Solana fails to maintain its position above the daily 200 MA, investors expect a return to the low demand levels around $140.
Related Reading
A stay above the 1D 200 MA will be important in determining the short-term direction of SOL. Investors are closely monitoring these levels, as they may indicate the continuation of bullish momentum or a possible reversal, leading to increased volatility in the coming days.
Featured image from Dall-E, chart from TradingView
Source link