Bitcoin has faced significant selling pressure above $100K, leaving the market leader struggling to recover. After a stellar rally, BTC is now testing its ability to push past critical resistance, as traders and investors remain cautious about its short-term trajectory.
Senior analyst Axel Adler recently shared insights on X, highlighting key metrics that suggest the market is entering a cooling phase. According to Adler, the Block P/L Count Ratio model—an indicator that tracks Profits and Losses within each block in the BTC network—shows a gradual decline in activity as profits are realized. Investors earning high returns in the $90K–$100K levels contributed to this change, indicating a potential slowdown after the turmoil.
The current market situation shows a mix of optimism and skepticism as BTC converges close to its psychological resistance. While broad sentiment remains cautiously bullish, cooling market forces could extend the consolidation phase.
As Bitcoin struggles to overcome this key barrier, the next few days will be crucial in determining its direction. Whether BTC manages to push above $100K or reaches an extended consolidation, its performance will likely set the tone for the broader crypto market.
Bitcoin Facing Risks
Bitcoin’s struggle to regain the $100K mark has put the market leader at a crossroads. Although the price shows strength, every day spent below this critical level raises questions about the strength of the bullish structure. To ensure a continued rally, BTC must break and hold above $100K, showing renewed confidence in the market.
Axel Adler recently shared important insights on X, shedding light on the current market dynamics. Adler’s analysis focuses on the Block P/L Count Ratio model, a key metric that tracks Profit and Loss activity within each 10-minute block of Bitcoin. The data shows that after investors locked in a big profit in the $90K–$100K range, the metric dropped significantly, from over 100K levels to 159. This sharp decline suggests a cooling market as trading activity slows and participants reassess their positions.
Adler notes that the amount of time BTC will spend at these levels is largely dependent on demand. If buying pressure remains, the market may struggle to sustain its current valuation, increasing the risk of a deep correction. On the other hand, increased demand may quickly return BTC above $100K, dominating the bullish trend.
The coming days will be crucial in determining the direction of Bitcoin. A decisive reclamation of $100K will reinforce its positive outlook, while extended consolidation below this mark may test investor confidence. As traders monitor these developments, Bitcoin’s ability to navigate this critical phase will likely shape the broader direction of the crypto market.
Struggling Below Key Move Rate
Bitcoin is currently trading below the critical 4-hour 200-hour level at $98,208, an important level that must be recovered to confirm the bullish structure. This mark has become a key point of resistance, and the price seems to be setting a low top in the main currency range between $108K and $92K. This indicates potential risks of further declines if momentum does not change soon.
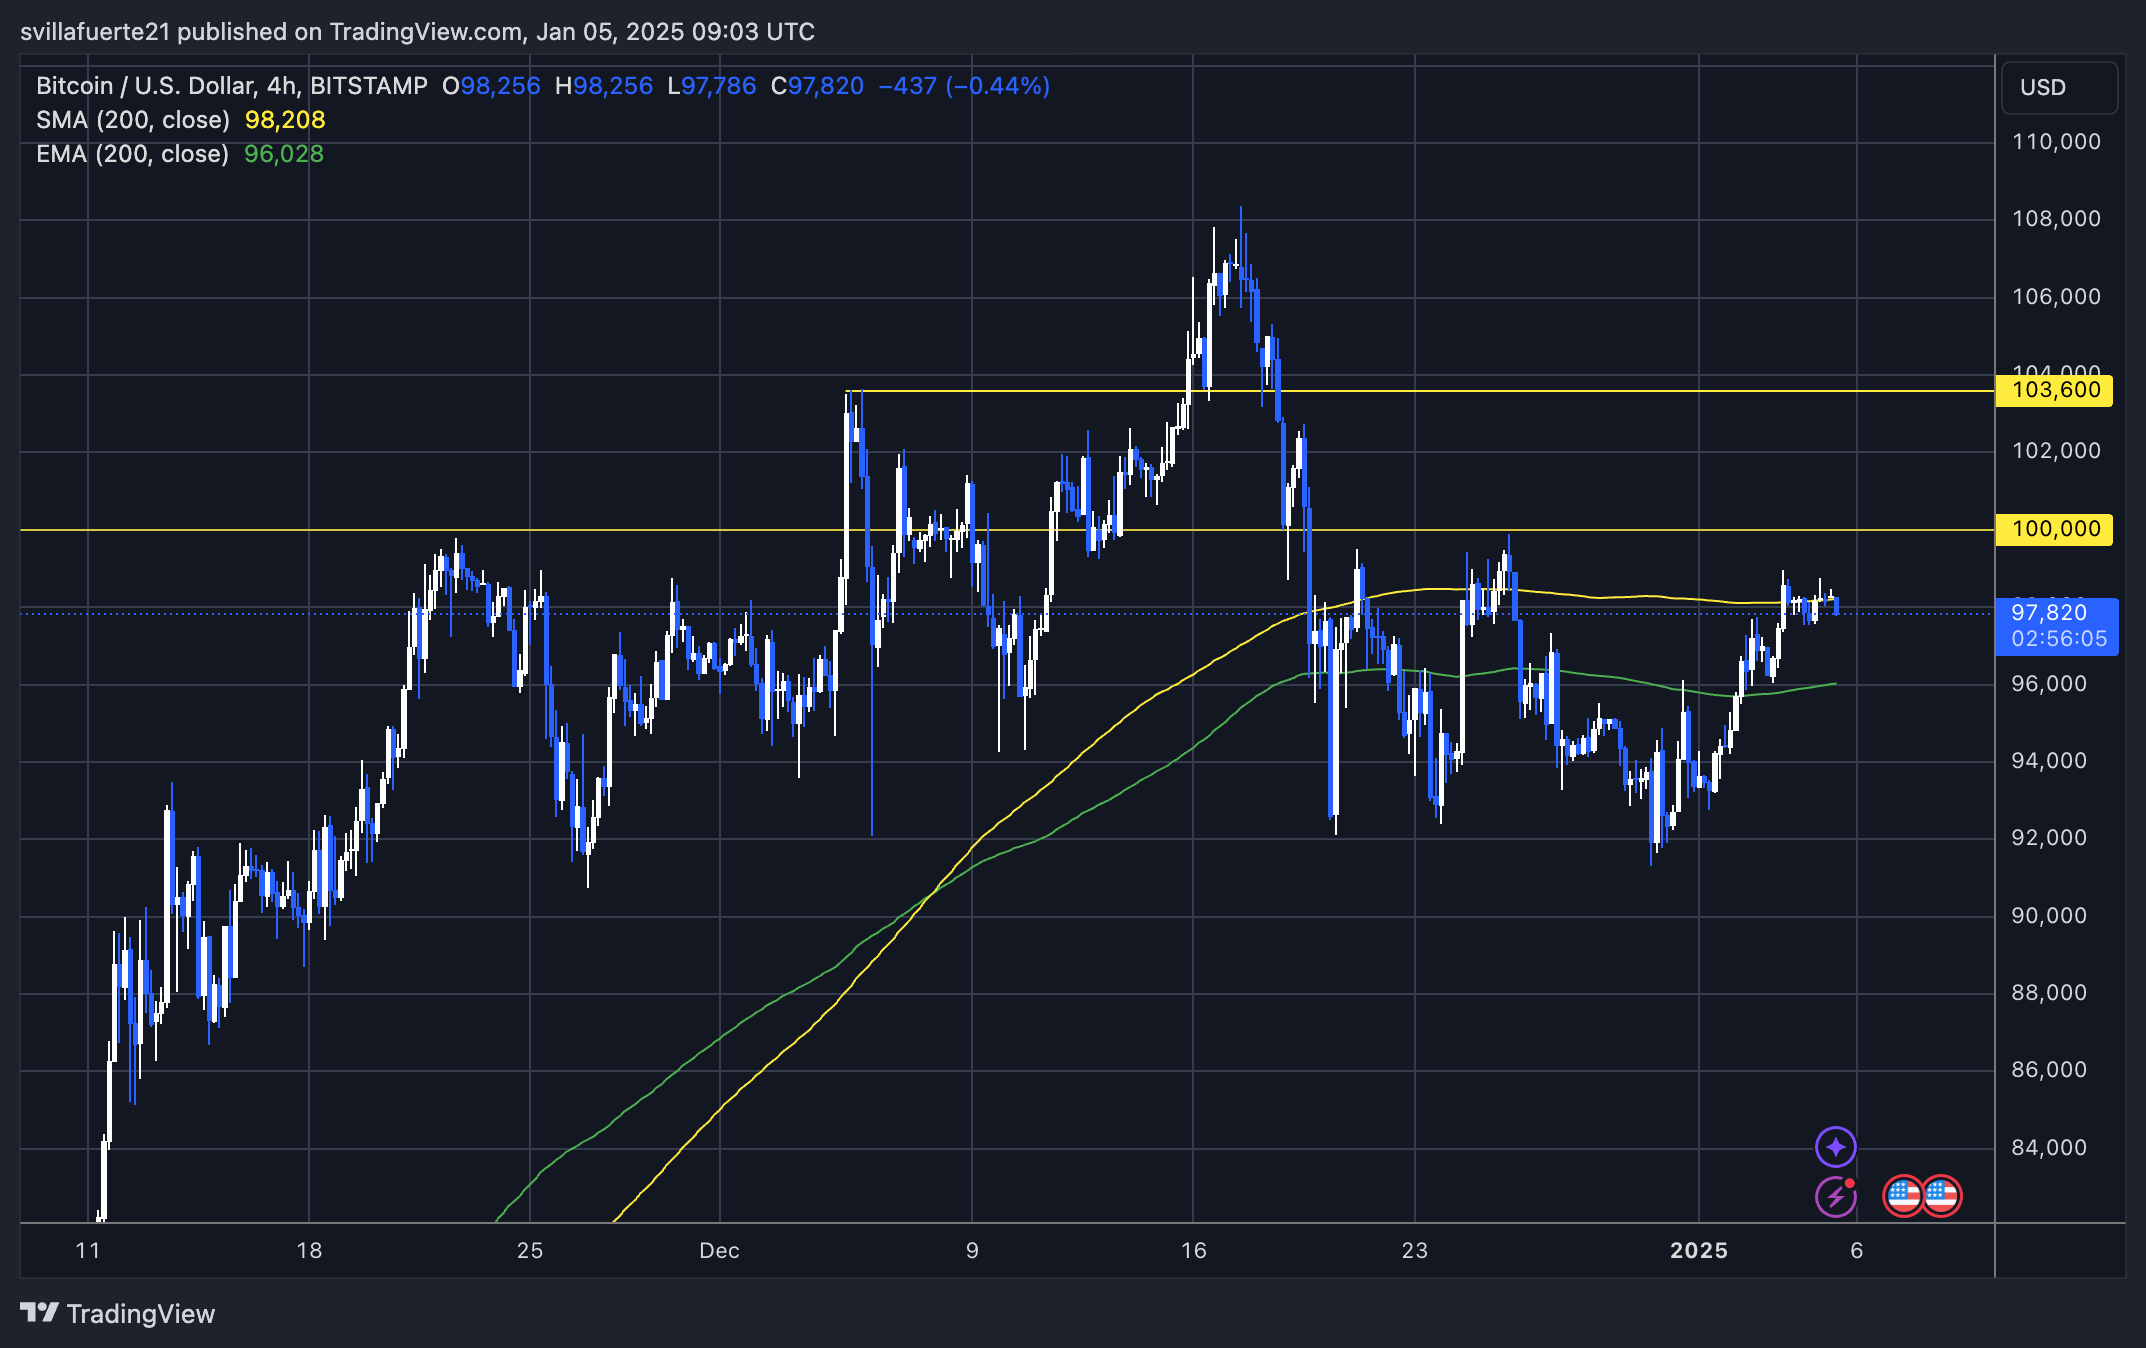
The $98,208 level is important for Bitcoin’s short-term trajectory. Failure to break above this moving average may indicate that bearish pressure remains strong, which could propel the price to the much sought-after areas near $92K. Such a move would challenge the prevailing bullish narrative and test investor confidence.
For the bulls to regain control, BTC must break above the $100K mark in the coming days. A successful move above this psychological and technical level could result in a strong rally, attracting renewed buying interest and strengthening a bullish formation.
Featured image from Dall-E, chart from TradingView
Source link