After weeks of consolidation, Ethereum (ETH) appears to be exploding higher from the $3,200 to $3,500 trading range. Bullish technical indicators on the ETH chart, combined to strengthen fundamentally, it suggests a huge upside potential for the second largest cryptocurrency by market cap.
Is Ethereum Eyeing $4,000 Target?
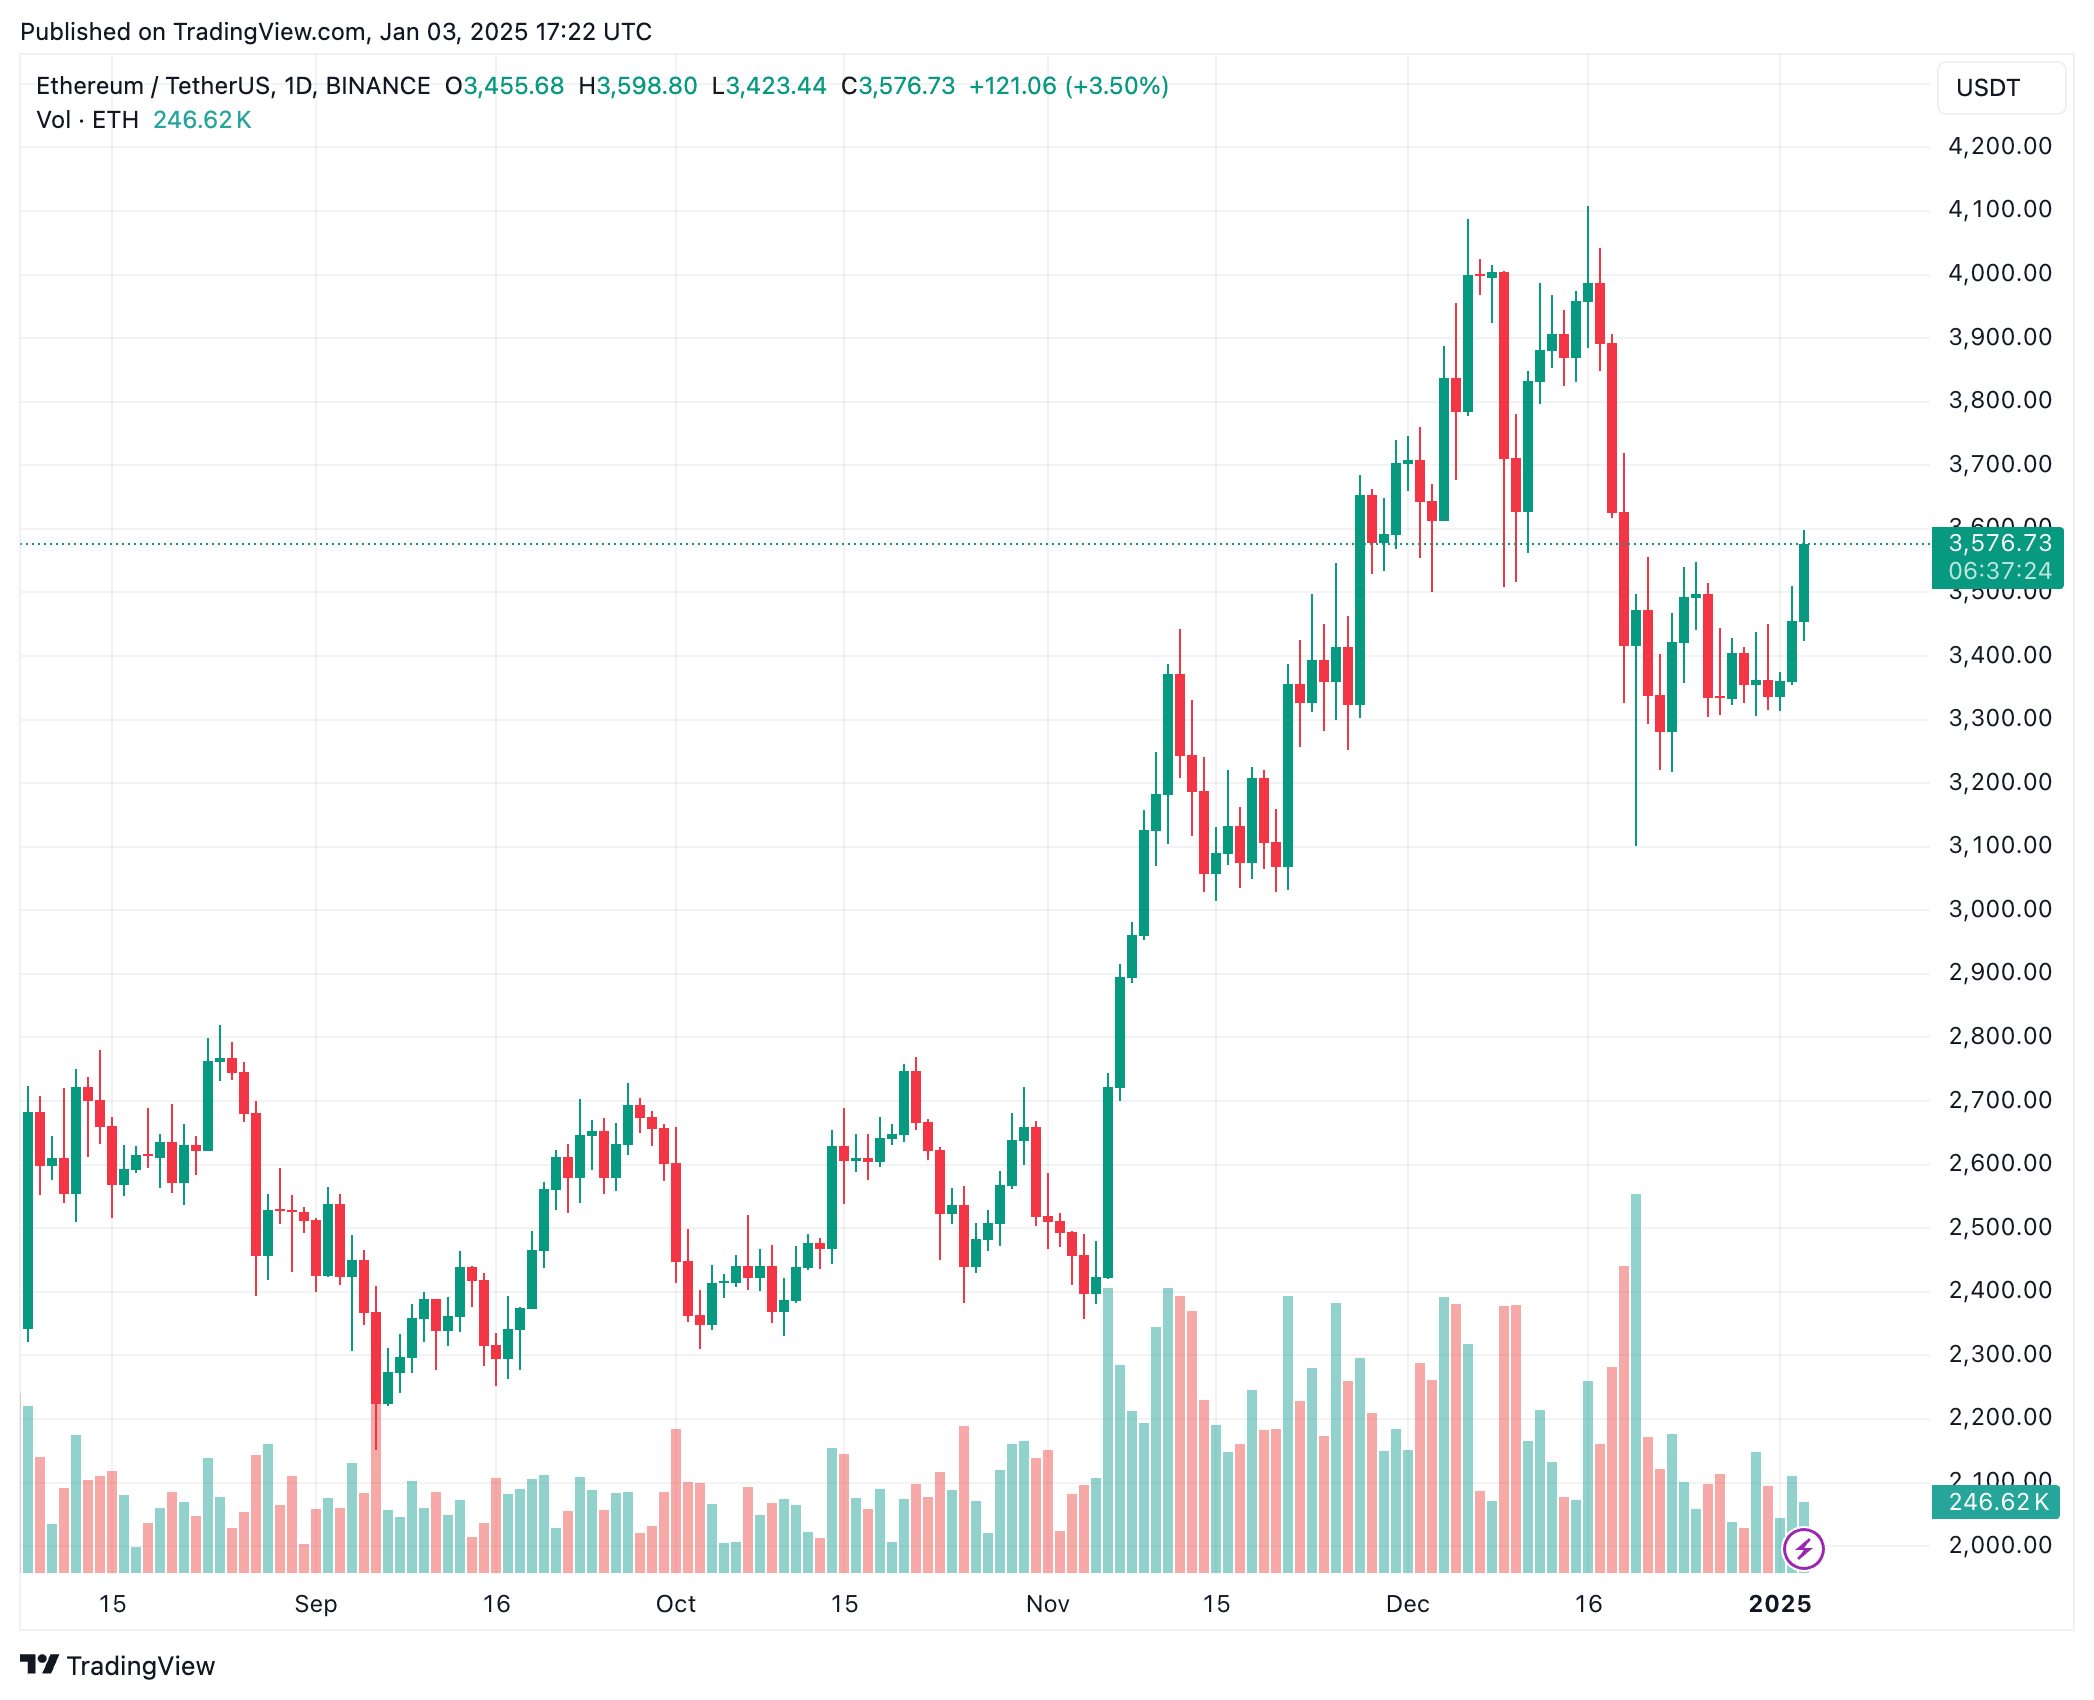
Last month, Ethereum tried to break the key $4,000 resistance level twice but failed both times. Between December 16 and December 19, ETH fell sharply, dropping from $4,000 to as low as $3,100 – a drop of more than 20% in three days.
Since December 19, ETH has remained in a bind, fluctuating between $3,200 and $3,500, causing concern about a possible drop below the $3,000 level. However, ETH is showing signs of resurgence today, breaking out of an equilateral triangle pattern, with $4,000 emerging as the first major resistance level to overcome.
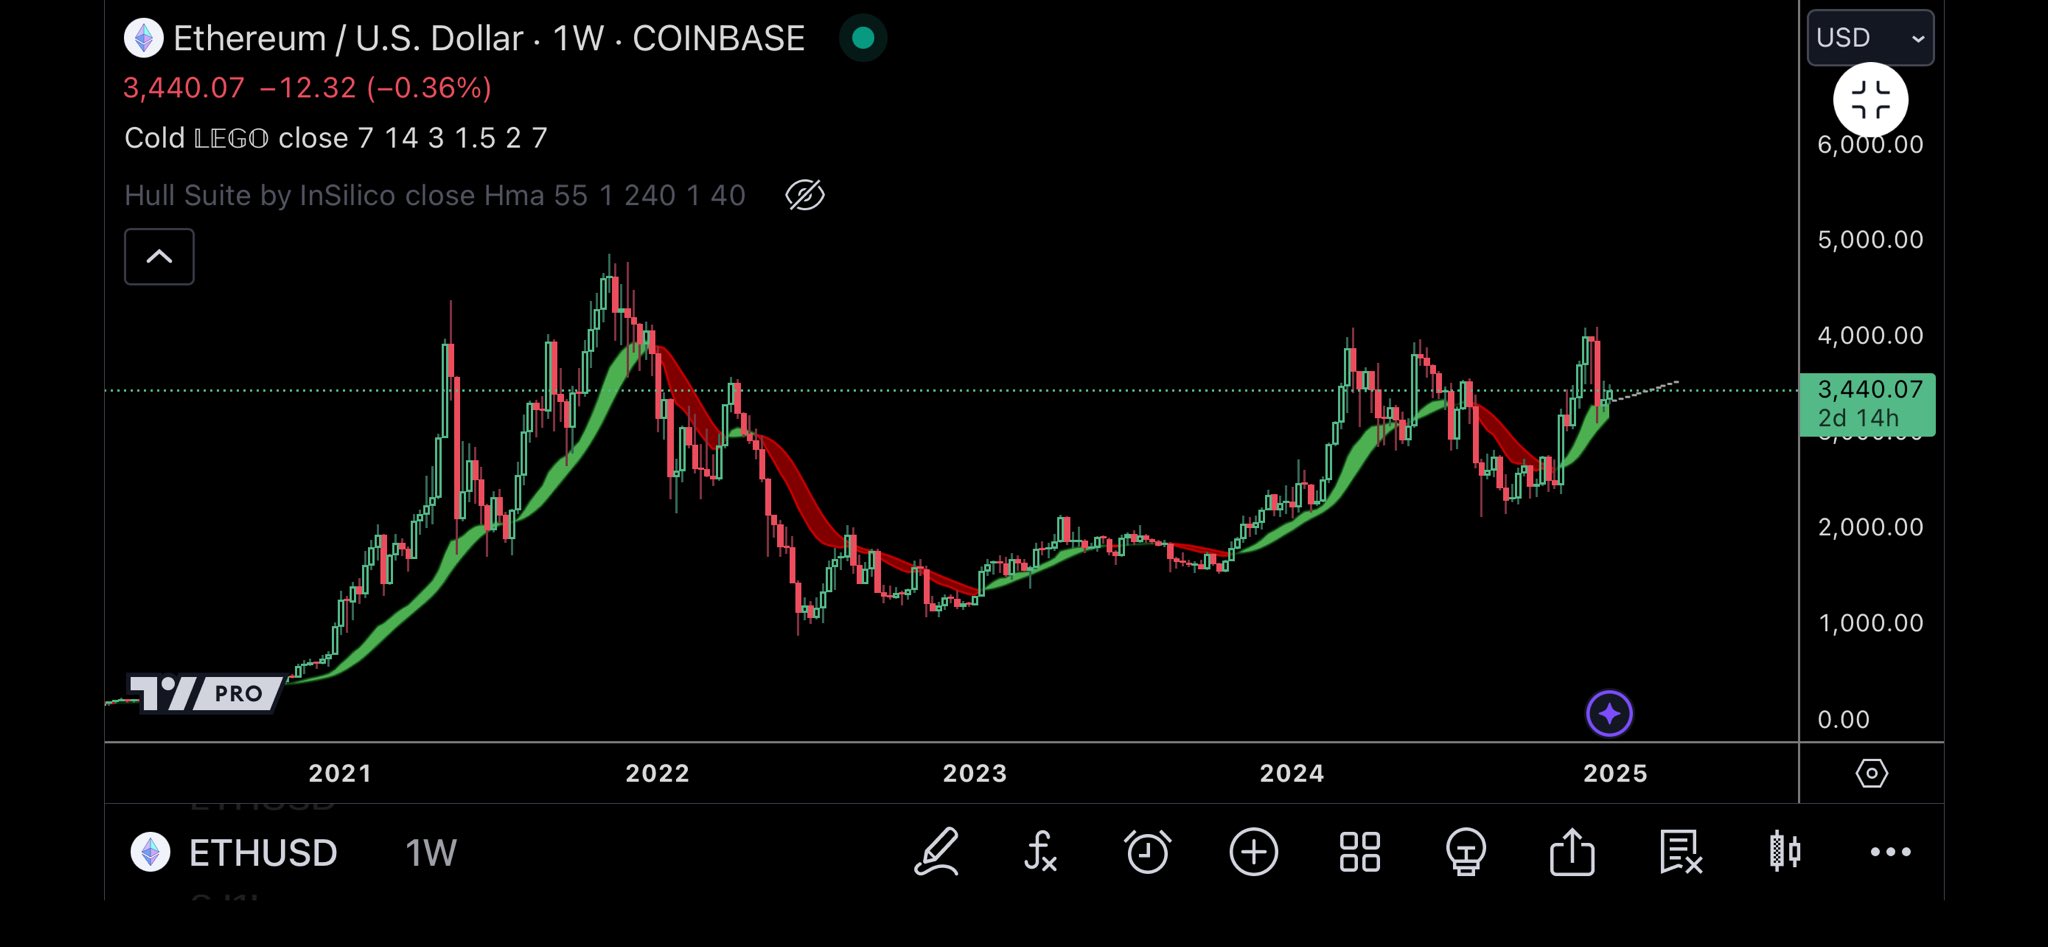
Crypto trader and analyst Cold Blooded Shiller noted that Ethereum’s weekly Relative Strength Index (RSI) has reset, which could provide the impetus needed to push ETH above $4,000. The analyst added that if ETH exceeds $3,500, they plan to increase their holdings.
For the uninitiated, a weekly RSI reset occurs when the RSI, a momentum indicator, retreats from overbought or oversold levels to its midpoint, usually indicating that a potential trend reversal or consolidation is underway. In the context of Ethereum, this reset could indicate reduced selling pressure and the possibility of a rebound.
Seasoned crypto trader TraderSZ echoed similar sentiments. In a post on X, the analyst shared Ethereum’s weekly and monthly charts, suggesting that a breakout may be imminent.
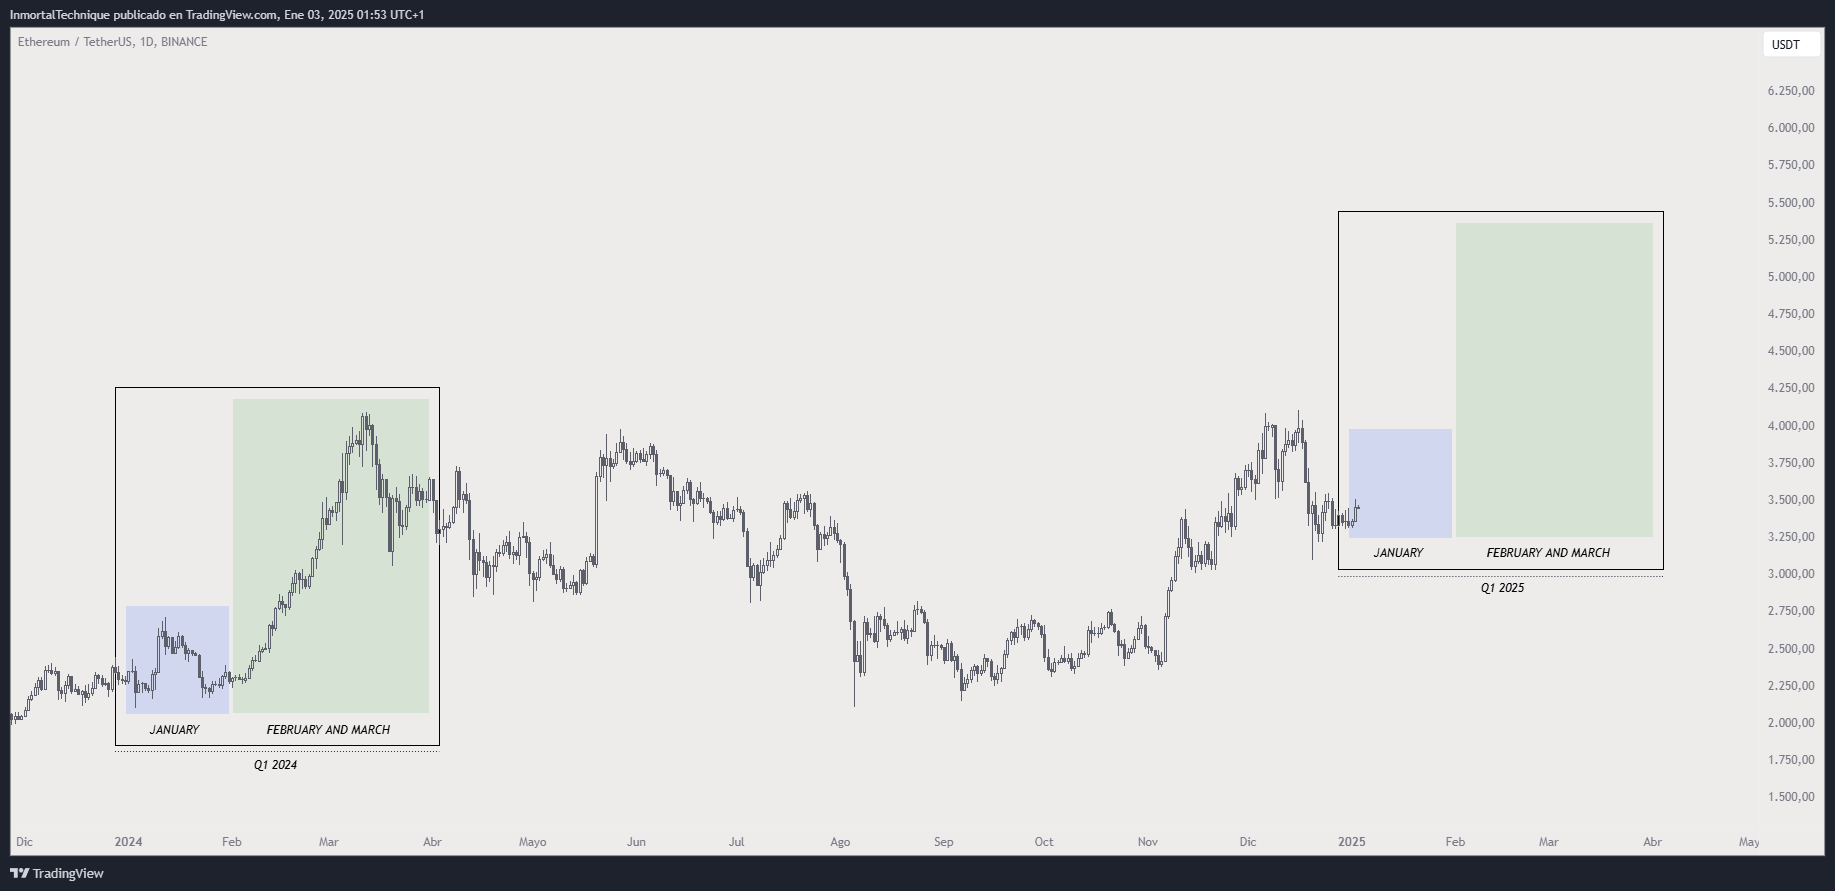
Another prominent cryptocurrency analyst, known as Inmortal, has weighed in on the potential value of Ethereum. In their analysis, Inmortal compared the current price action of ETH with Q1 2024, highlighting the similarities between the two periods.
According to the following chart, January tends to act as an accumulation phase, while February and March tend to experience parallel price movements. If ETH follows the same pattern in 2025, it could target $5,300.
Will Ethereum’s Rise Start an Altseason?
While Bitcoin (BTC) saw an unprecedented price increase in 2024 – briefly touching six-figure territory – Ethereum has yet to experience comparable explosive growth. ETH’s current all-time high (ATH) dates back to November 2021, to emphasize that ETH is lagging behind BTC during this cycle.
However, recent market trends indicate that ETH may in the end gain ground against BTC, as evidenced by the steadily increasing ETH/BTC ratio. Additionally, the dominance of Bitcoin is evident stop by declining after making a lower high on the weekly chart.
This change could pave the way for the long-awaited altseason, giving a boost to ETH and other altcoins. At press time, ETH is trading at $3,576, up 3.2% in the last 24 hours.
Featured image from Unsplash.com, Charts from X and TradingView.com
Source link