Ethereum had a poor 2024, underperforming Bitcoin and many top altcoins throughout the year. While BTC surged to record highs, ETH struggled to regain its momentum, leaving investors questioning their position in the market. However, next year can tell a different story, as historical trends suggest that altcoins, including ETH, tend to shine during the post-halving year.
One of Ethereum’s strengths lies in its growing popularity and strong investor base. According to key metrics from IntoTheBlock, the ETH hodler rate has surpassed BTC, indicating a change in long-term holding sentiment. This historic event is particularly noteworthy as Bitcoin holders have recently taken advantage of BTC’s new highs, reducing their value in the market.
This dynamic may set the stage for ETH to regain dominance and lead a potential altseason in 2025. As more ETH is held by committed investors, the supply available for trading is limited, which may drive prices to appreciate once demand is restored.
As Ethereum enters a new cycle, the market is eagerly watching for signs that could drive its recovery and potential breakout in the coming months. Whether ETH can capitalize on these metrics remains to be seen, but hopes for a bright year are growing.
Is Ethereum Losing Power?
Many analysts and investors are beginning to believe that Ethereum is approaching a potential dark period after struggling to break its annual highs and continuing to set lower highs. Despite the growing optimism surrounding Ethereum’s long-term potential, the lack of bullish price action has left many questioning its near-term outlook.
Ethereum’s price movements have been sluggish compared to Bitcoin and other altcoins, leading some to think that ETH may be headed for a challenging phase in the market.
Senior analyst Maartunn recently shared important information on X, revealing that Ethereum’s hodler rate has surpassed Bitcoin. This change is important as it highlights that many investors are holding on to ETH for the long term, especially with Bitcoin’s recent gains encouraging many holders to take their gains. This has led Maartunn to ask an important question: Will Ethereum hodlers follow when ETH finally breaks its previous high?
Although the vision of 2025 may be bright for Ethereum, with its growing adoption and the possibility of an altseason, there is a risk in maintaining the current trend. If ETH fails to break its previous ATH and continues its lower high pattern, it could show a long consolidation phase or even a deep correction.
Market sentiment and key data points will be key in determining whether Ethereum can capitalize on positive trends in the coming year or face a more challenging road ahead.
ETH Testing Liquidity Before The Next Push
Ethereum is currently trading at $3,400 after several days of consolidation below the key $3,550 level. Price action appears to be bearish, as ETH failed to hold this level as support, instead continuing to make a series of lower highs. This ongoing trend suggests that selling pressure is dominating the market, and unless ETH is able to regain strength, the decline may be extended further.
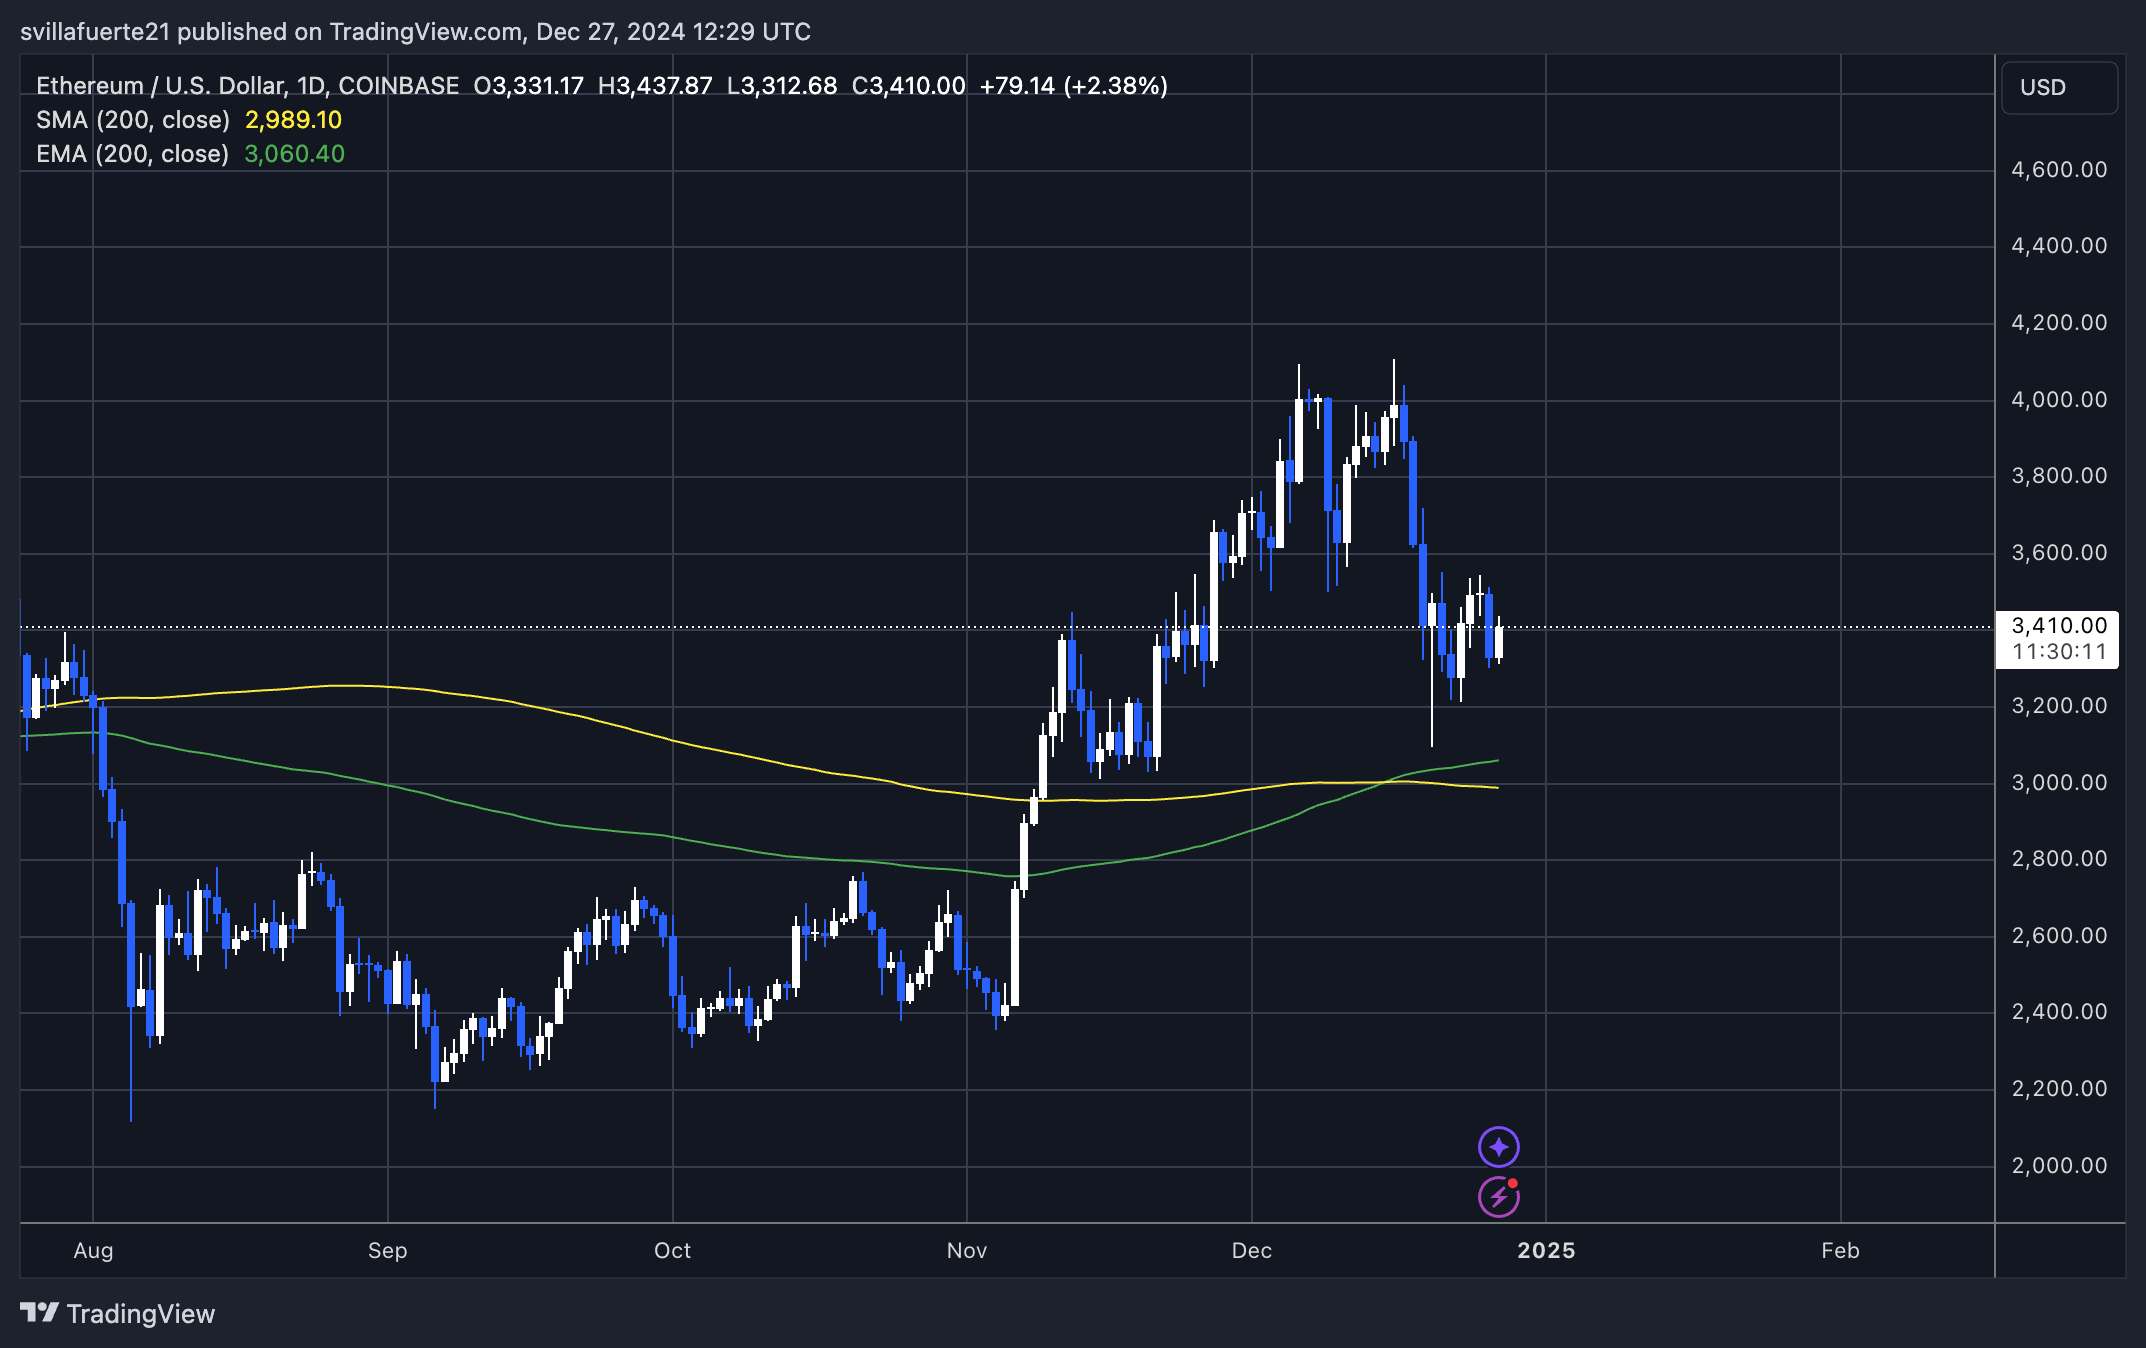
However, there is still hope for Ethereum if it can break above the important resistance level of $3,750. A push above this mark would indicate a potential reversal and could set the stage for a strong rally. If the bulls can recapture $3,750 and hold it as support, ETH will likely see a major, potential surge to the top in the coming weeks.
In the short term, Ethereum’s ability to break and hold above $3,750 will be important in determining the next big move. If this level is rejected again, ETH could continue its bearish trend and face deep corrections. Therefore, investors and analysts will be watching closely for any signs of respite to confirm the next direction of the Ethereum price.
Featured image from Dall-E, chart from TradingView
Source link