This article is also available in Spanish.
Dogecoin (DOGE) has entered a period of weakness, sliding nearly 16% since its November 23 local high of $0.4795. As the first meme cryptocurrency struggles to find critical technical levels, the consensus among some analysts is that DOGE’s ability to stabilize or recover may depend almost entirely on an external factor: Bitcoin’s trajectory.
Dogecoin Price Vulnerable to Another Drop
Technical analysis suggests that the previously respected uptrend line, established in mid-November, has now become a formidable barrier. After breaking this support line earlier in the week, Dogecoin bulls tried several times to bring the price back above it. However, none of these efforts were successful.
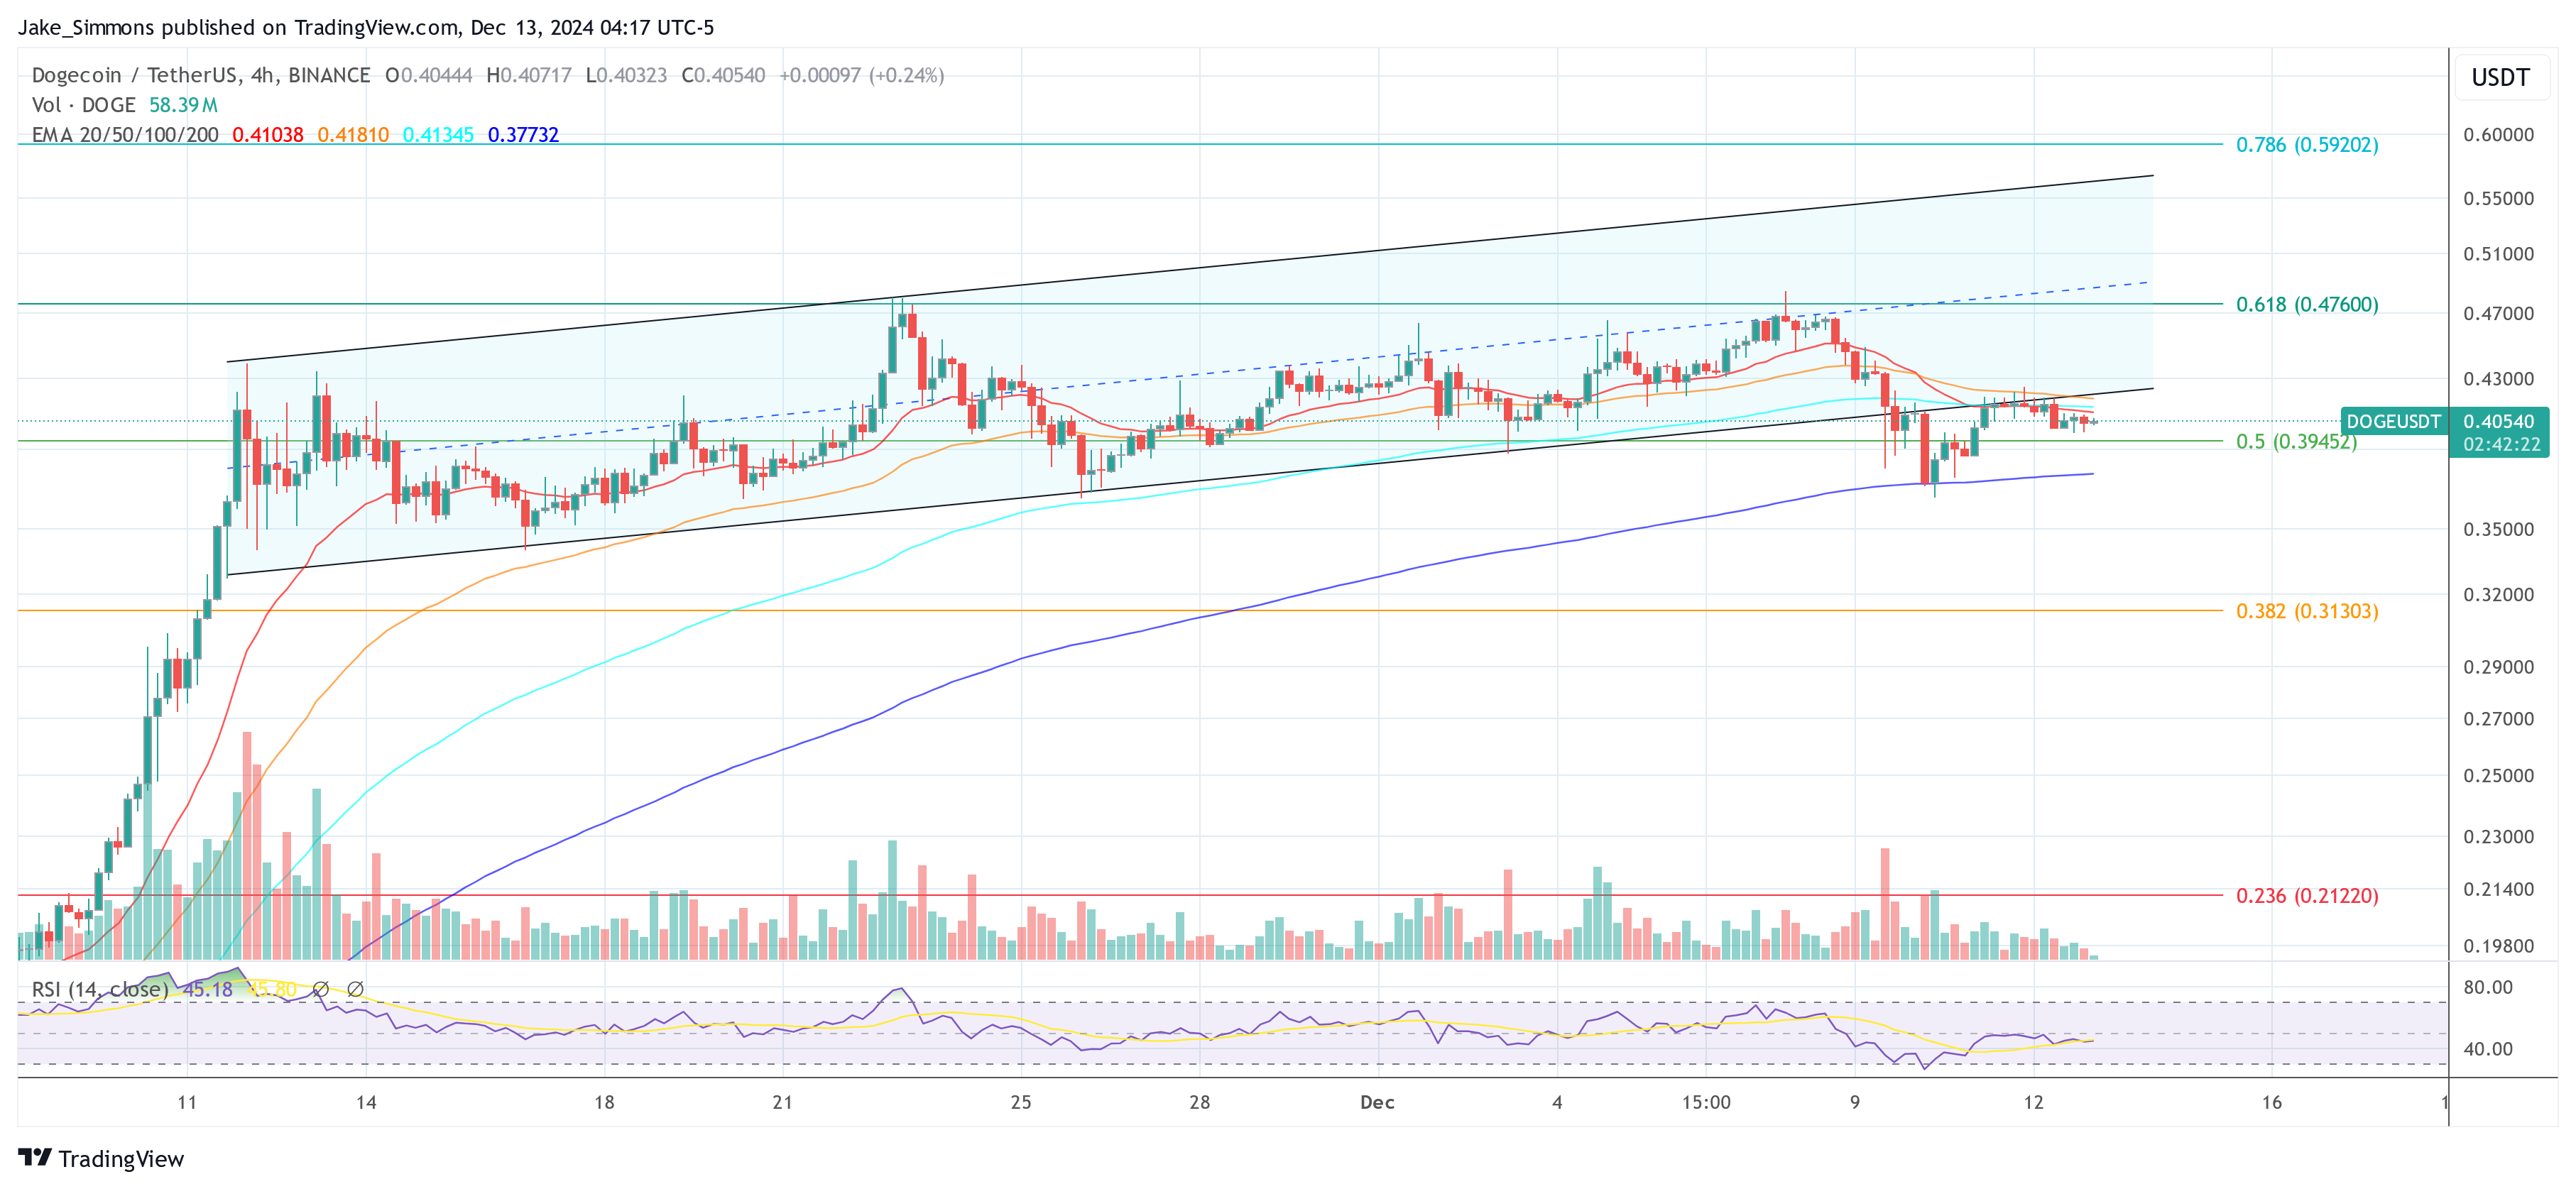
Crypto analyst Kevin (@Kev_Capital_TA), who has been closely tracking the 1-day chart of DOGE/USD, notes that DOGE is “rejecting a retest of this trend line that we have held for almost a month above which is sitting right at macro .786 Fib.”—a technical area often associated with key turning points and potential reversals.
Beyond the trend line, internal momentum indicators paint a challenging picture. Kevin emphasizes that DOGE’s daily MACD shows “strong downward momentum,” a technical signal that suggests the market’s short-to-medium-term bias may decline unless the broader crypto environment changes.
Related Reading
In his opinion, “It is safe to say that unless BTC goes higher the possible movement of DOGE in the short to medium term is down. The rise of BTC can save us.” He identifies $0.32—the origin of the previous uptrend line—as the first downside target. Should DOGE fail to hold above that level, traders may look to the $0.29 to $0.26 range as possible next stops.
In another post on X, Kevin emphasized that the price of Dogecoin is pinned between two critical long-term Fibonacci levels. He describes the DOGE currently as “trading within a large gold pocket,” around $0.47, and the macro 0.5 Fib level near $0.39. According to him, a strong break above or below these key levels may result in what he calls a “downward” effect of “aggressive movements.”
He adds: “My position is that DOGE cannot control itself and its fate is only in BTC’s hands at the moment so focusing too much on assets is a waste of time. I don’t see anything telling me that the cycle is over so this should go up soon with no temporary noise. There’s nothing else to do but sit back and wait if you’re a long-term owner who got in early like me.”
However, there is at least one silver lining to note. Kevin says “he’s next [a] a possible hidden bullish divergence” on the daily DOGE chart. A latent bullish divergence occurs when price action continues to be high over a long period of time, while momentum indicators—such as the Relative Strength Index (RSI)—are declining.
Related Reading
This pattern can sometimes indicate that the underlying strength of the market is greater than it appears. It is, as the analyst puts it, “a good textbook” for now, although it still needs significant help from Bitcoin. “I still need BTC to cooperate so nothing is guaranteed,” Kevin said.
What About Bitcoin?
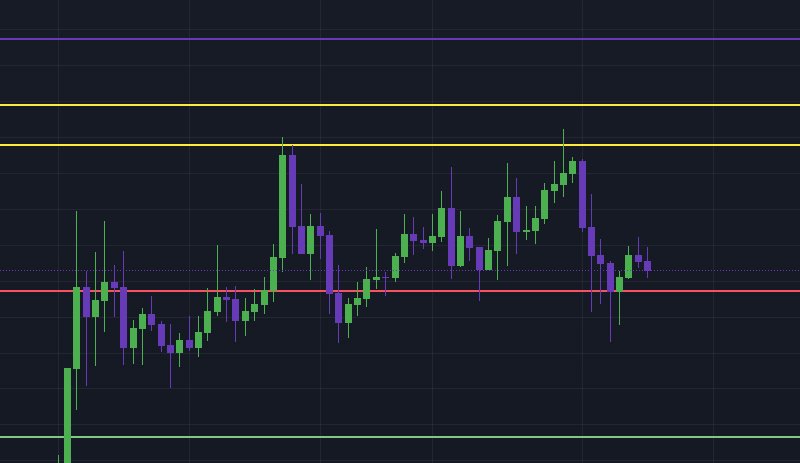
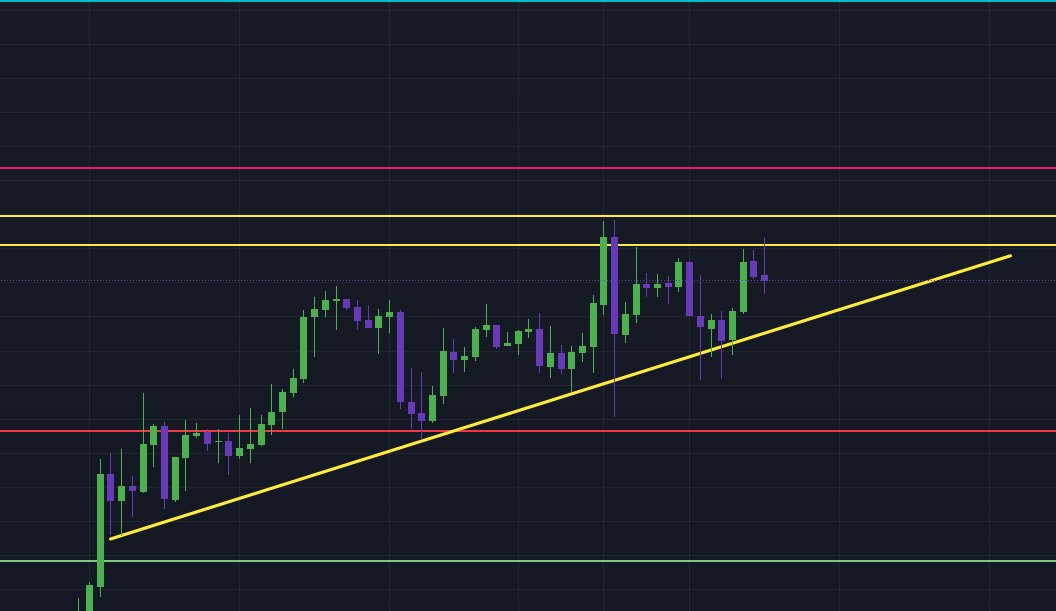
Kevin points out that Bitcoin is currently “squeezing” between an ascending support line and a large gold pocket—the levels taken from the previous bull market high to carry the bear market. This strengthening price action suggests a near-term solution: BTC is unlikely to remain under pressure in this area for long. A decisive outbreak, in any case, appears imminent and could have far-reaching consequences. “This combination of the above cannot last long. We will face both ways soon,” Kevin predicted.
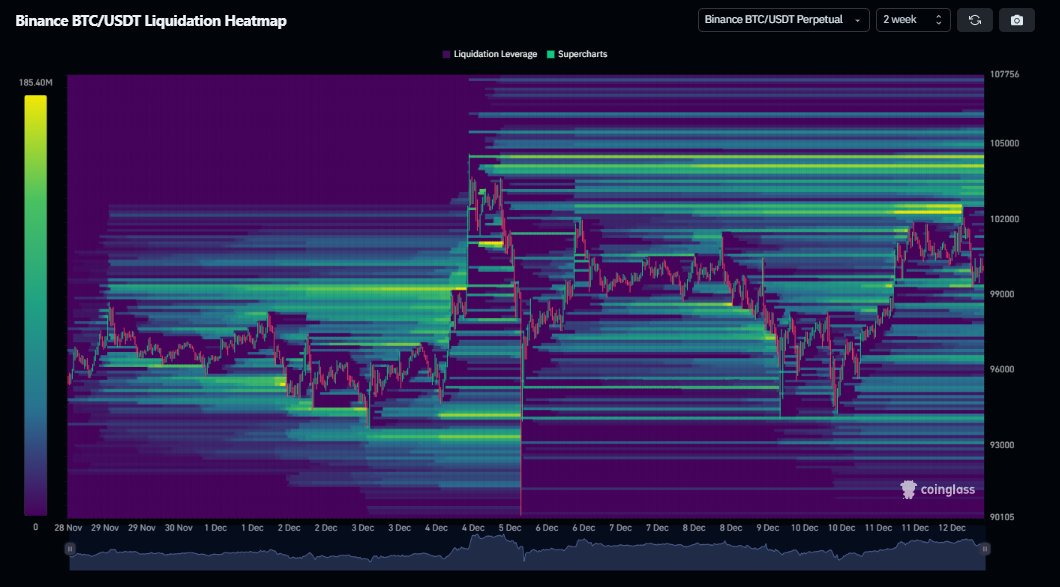
On the liquidity front, Kevin sees high liquidity blocks for BTC, noting that “money built” in the last 48 hours coincides with the macro 1.703 Fibonacci level. He also talks about looking at data that shows whales are buying big call options on MicroStrategy (MSTR) stock. Such purchases may indicate a desire to move higher for BTC, given MicroStrategy’s Bitcoin Treasury Holdings. If these bullish and liquidity indicators are correct, and BTC indeed goes higher, DOGE may find the “one lifeline” it needs to stabilize and reverse its current decline.
At press time, DOGE traded at $0.405.
The featured image was created with DALL.E, a chart from TradingView.com
Source link