This article is also available in Spanish.
In a remarkable show of strength amid an otherwise subdued market, Cardano (ADA) rose above the psychologically important $1 mark today, January 3. In the past 24 hours, ADA has grown more than 11%, outperforming the more subtle performance of other -top cryptocurrencies, including Bitcoin.
Among the top 100 assets by market capitalization, only Murad-memecoin SPX6900 (SPX) registered the highest 24-hour gain, rising by 30%. In the past seven days, ADA has increased by almost 20%.
Although the jump seems to have come without an immediate catalyst, Cardano’s road is set for significant improvements to the protocol in the coming months. Among them are a Bitcoin-centric decentralized financial ecosystem and ongoing initiatives aimed at improving Cardano’s stability, distribution, and interoperability with other networks.
Related Reading
These fundamentals suggest that the current price action may be supported by broad optimism about the evolution of the network, although technical factors seem to be the main cause. “The ADA is pushing its butter resistance. This momentum is really explosive. Pay attention to key resistance levels, this one wants to go higher,” said crypto analyst Satoshi Stacker (@StackerSatoshi) via X.
Cardano Price Analysis
On January 1, ADA/USDT broke out of a multi-week downtrend that began on December 2 at a high near $1.32. This trend was tested several times until the end of December, before finally succumbing to strong bullish momentum. After the initial breakout, ADA retreated slightly to around $0.87, then bounced back to a retest of the book confirming a trend line breach.
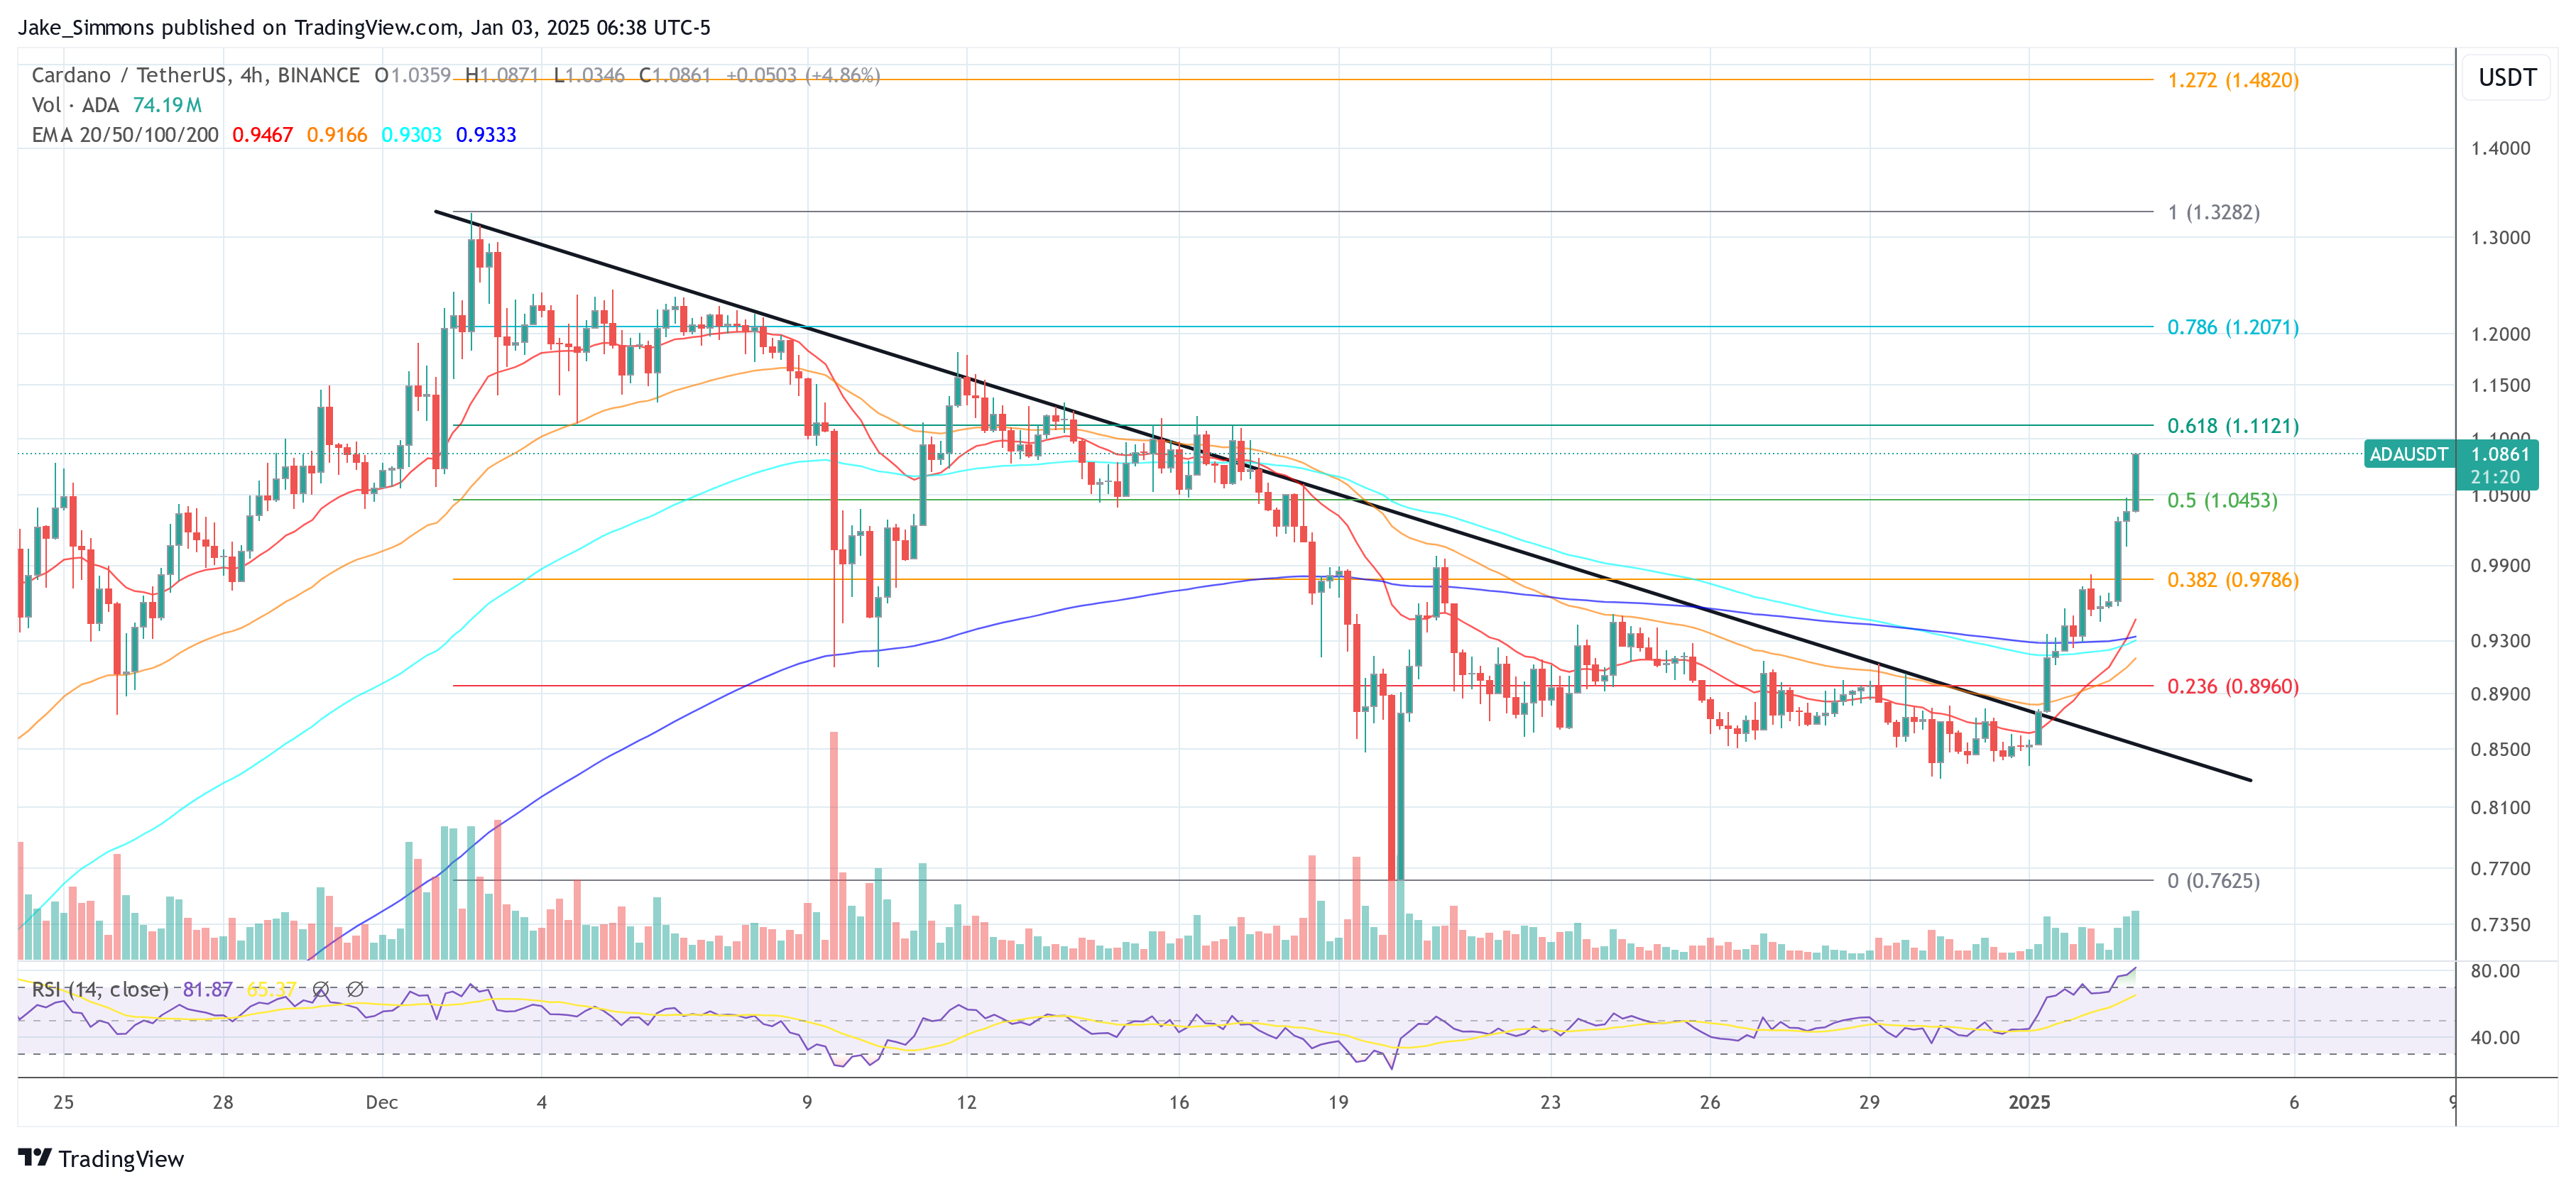
Supporting the bullish narrative, Fibonacci retracement levels centered on the December high ($1.32) and December 20 low ($0.76) reveal a constructive technical backdrop. The 0.236 Fib at $0.89 served as a launch point where a trendline break was confirmed, while the 0.382 Fib ($0.97) initially rejected prices on January 2, before later giving way to further upside.
Related Reading
Next, the ADA crossed the 0.50 Fib ($1.04), and this level may now act as an immediate support for any minor reversal. 0.618 Fib ($1.11) is the next key barrier if bullish momentum persists, while 0.786 Fib ($1.20) and 1.0 Fib ($1.3282) are likely if the rally extends into the near to medium term.
From a moving averages perspective, ADA has risen above the 20, 50, 100, and 200 moving averages on the four-hour chart. Notably, the 20 and 50 EMAs have fallen above their 100 and 200 counterparts, indicating that the momentum has shifted in favor of the bulls. The volume picture also supports the explosive situation, with a 24-hour trading volume up 14.94% to $1.67 billion.
A look at the Relative Strength Index (RSI) in the four-hour period shows a reading of around 80, placing the ADA firmly in an overbought zone. This indicates strong buying pressure but also suggests the possibility of a short-term pullback if traders choose to take profits.
Featured image from Shutterstock, chart from TradingView.com
Source link