Bitcoin is currently trading at $66,800 after a week of significant volatility. The price is holding steady above the key support level of $65,000, showing resilience as the market takes a breather after several weeks of growing excitement. This consolidation phase below the key $70,000 mark suggests that BTC may be preparing for its next big move.
Data from CryptoQuant reveals that the demand for Bitcoin remains strong, even in the midst of cooling pressure. This strong demand is a positive indicator, suggesting that market participants are hoarding BTC at current levels, anticipating further possible upside. Analysts interpret this data as a sign that BTC is poised to rise once market conditions align.
The average trading volume in each 15-minute interval in the last 24 hours was 60 BTC, marking the highest point in the last two months. Such high trading volume highlights active participation and growing interest in the current price range, further supporting breakout potential.
As Bitcoin consolidates within this range, the $70,000 resistance level remains an important threshold. A break above could attract more buyers and signal the start of a stable rally. With these volume and demand indicators in play, BTC can quickly use this momentum to target new highs.
Bitcoin Trading Volume Shows Strong Demand
Bitcoin shows resilience in a bullish perspective as trading volume reaches levels not seen in two months. Senior analyst and investor Axel Adler shared important information on X, revealing that the average trading volume of each 15-minute session in the last 24 hours was 60 BTC, marking the peak of the session. This peak in trading activity indicates strong demand, indicating strong interest in BTC even amid recent market challenges.
The increase in volume comes after Friday’s FUD (fear, uncertainty, and doubt) surrounding USDT, which may have caused a sell-off or skepticism among retail investors. However, the high trading volume suggests that large investors, often referred to as “smart money,” are instead seizing the opportunity to accumulate BTC at current levels. This accumulation phase is usually the precursor to a major price move, as these high-volume buyers often want to position themselves before a significant price change.
Analysts interpret this increase in volume as a signal that BTC is at an important level, reinforcing bullish sentiment across the market. If trading volume remains high, it may continue the momentum and support an exit above resistance levels in the near term. The strong demand under current conditions suggests that BTC could start its next rally, especially if it breaks through key resistance levels like $70,000.
If the volume can maintain these high levels, Bitcoin can confirm bullish signals and continue higher, driven by the basis of strategic accumulation and renewed investor confidence.
BTC Support Holding Strong
Bitcoin is currently holding above $66,000 after market volatility and uncertainty. This level, a significant area of liquidity, served as a strong resistance point in late September and has now turned into support, indicating potential strength in BTC’s trend. If Bitcoin is able to maintain its position above this key level, the push to new all-time highs seems to increase as buyer momentum builds and confidence returns to the market.
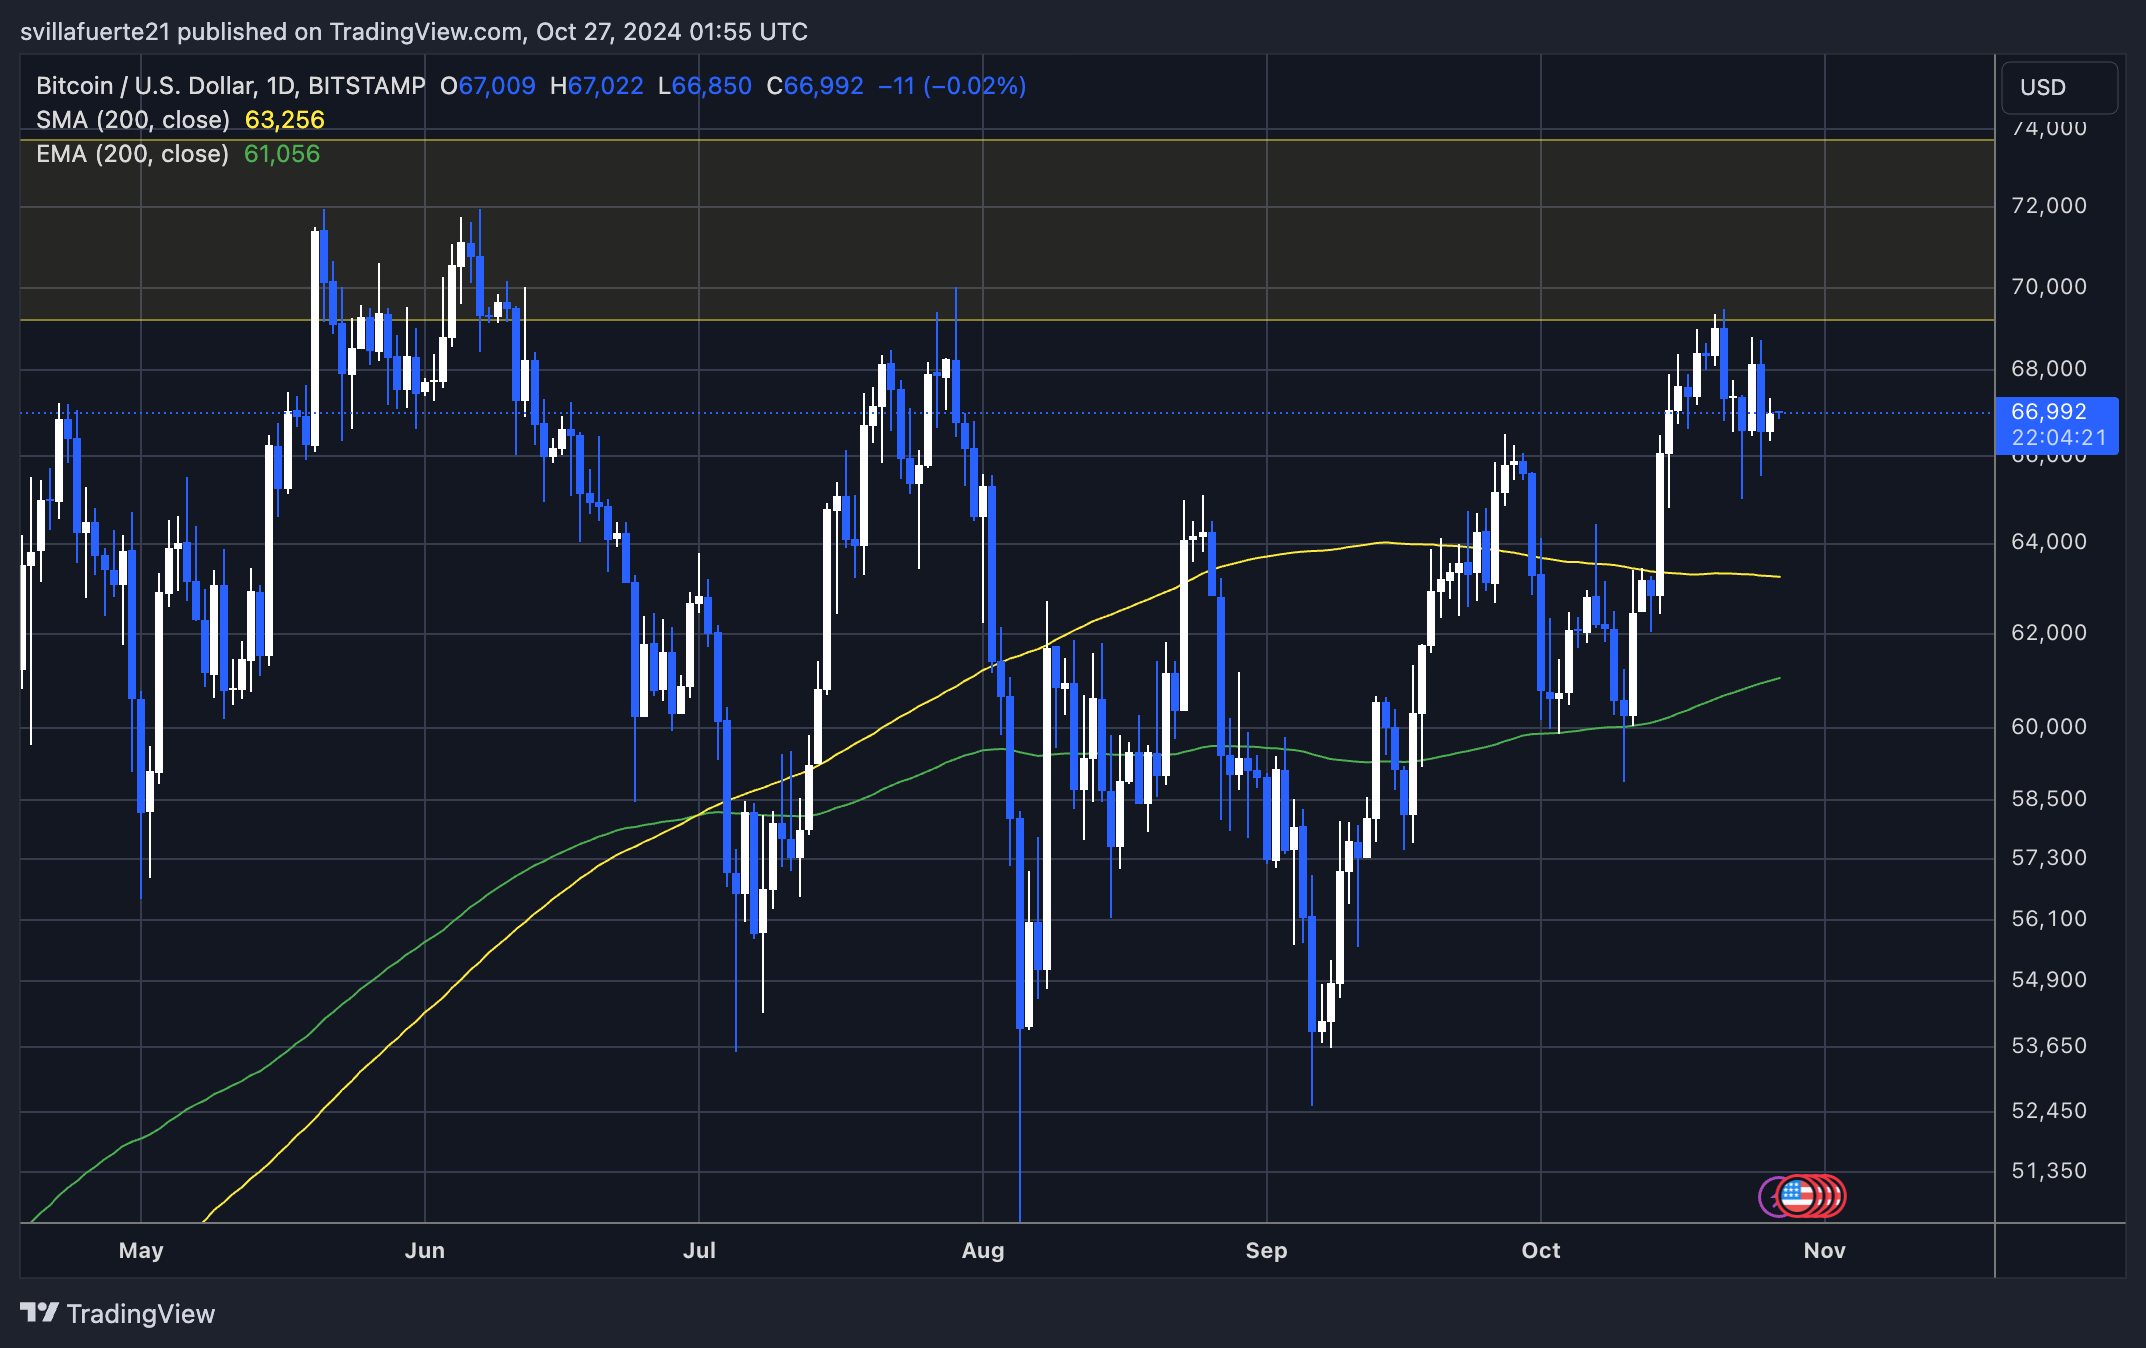
However, if BTC falls below the $65,000 mark, we could see the price enter a sideways consolidation period as it looks for new capital purchases. Such a consolidation phase may act as a market reset, giving bulls and bears time to rebalance themselves. For the bullish structure to remain intact, BTC needs to stay above the 200-day moving average (MA), currently at $63,250. This MA level represents an important threshold that market participants are watching closely, as a drop below could change sentiment and invite bearish pressure.
In the near term, maintaining strength above $66,000 could be the catalyst for a continuation of the upward trend, which could push BTC to challenge key resistance levels on the upward trend.
Featured image from Dall-E, chart from TradingView
Source link