On-chain data shows the Litecoin Daily Active Addresses index has seen a significant increase this year compared to last.
Litecoin Average Active Addresses Are Significantly Higher This Year
In a new post on X, market intelligence platform IntoTheBlock discussed the year-on-year growth of Daily Active Addresses for Litecoin. “Daily Active Addresses” refers to a metric that measures the total number of addresses that participate in some type of transaction activity on the network every day.
When the value of this index increases, it means that the unique number of addresses making transfers on the blockchain increases. Since a different number of addresses can be equated to a different number of users, this type of trend suggests that the traffic on the thread is increasing.
On the other hand, the metric that registers a decrease suggests that the interest of investors in cryptocurrency may be decreasing since not many users are participating in the on-chain activity.
Now, here is a chart showing the trend in Litecoin Daily Active Addresses over the past year:
Looks like the value of the metric has been flat in recent months | Source: IntoTheBlock on X
As seen in the graph above, Litecoin Daily Active Addresses peaked in 2024, but the metric cooled off shortly thereafter. There have been some breakouts since then, but overall, the index has shown a consistent sideways trajectory.
On average, there have been around 401,000 addresses interacting on the blockchain every day this year. While this is significantly lower than the high of 1.37 million from January when LTC surpassed both Bitcoin (BTC) and Ethereum (ETH), it is still about 10% higher than the 366,000 average from 2023.
Historically, Litecoin has generally tended to perform well in terms of transaction-related metrics, due to the fact that the network offers cheap and fast transactions. The increase in traffic seen by LTC compared to last year will mean that users are still attracted to this chain to use it as a payment method.
Recently, miners have also been investing in the network, as the total LTC hashrate, a measure of the miners’ computing power, has been increasing. Below is a chart from CoinWarz that shows this trend.
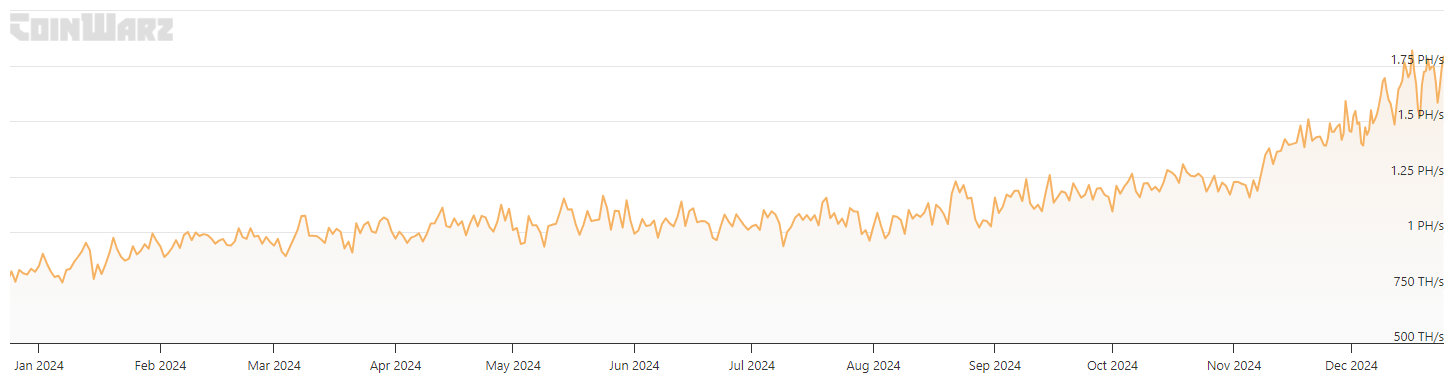
The value of the metric appears to have been growing over the last few weeks | Source: CoinWarz
An increase in Daily Active Addresses tends to build in any cryptocurrency, as it means there is growing interest in the network, which may help fuel price movements. LTC hasn’t done the best in terms of price action recently, but strong traffic and miners’ confidence may help it reverse course.
The highest amount of LTCs
Litecoin dropped to the $86 mark at the end of last week, but it seems that the coin has seen a jump since then as its price is now trading around $110.

The price of the coin seems to have plunged since its high earlier in the month | Source: LTCUSDT on TradingView
Featured image from Dall-E, CoinWarz.com, IntoTheBlock.com, chart from TradingView.com
Source link