Bitcoin finds itself in a critical position after weeks of extreme volatility, marked by euphoria and fear. Currently trading around $59,400, BTC is testing key demand levels following a 10% dip from local highs around $66,000.
This latest price action has caused uncertainty for investors, some of whom remain hopeful of new all-time highs in the cycle. Many are closely monitoring Bitcoin’s next move as the crypto market reacts to external factors.
A notable crypto analyst shared a long-term chart that highlights an interesting trend: historically, October often marks the beginning of BTC’s bullish run. This insight adds an element of hope to those looking to take advantage of the potential momentum.
As the market grapples with mixed emotions, all eyes are on Bitcoin to see if it can regain lost ground and rally higher.
The coming days will be crucial as traders assess whether BTC can maintain its bullish trajectory or if another correction is in store. Given historical patterns and current market dynamics, investors are watching with interest to see how this narrative unfolds.
Bitcoin Post-Halving Surge: Is It Near?
Bitcoin is currently navigating a highly volatile environment, leaving traders and investors uncertain. The price did not show clear signs of direction or specific targets, causing concern among market participants.
Many analysts fear that the expected bull run following the recent halving may not materialize this time around, potentially leading to missed opportunities for potential gains.
However, top crypto analyst Ali offers a glimmer of hope. He recently shared a compelling technical analysis on X, with a chart that underscores an important trend: all major Bitcoin rallies historically began in October within half a century.
According to this analysis, Bitcoin started a parabolic bull run every October following the halving events, and many believe that this cycle should follow suit. This historical data has prompted many traders and investors to hold on to their currencies, looking for a possible rebound.
This strategy may be beneficial to some, possibly leading to greater profits. On the contrary, it can also cause problems for people who are overly optimistic, especially if BTC fails to live up to these expectations.
As it happens in October, the market is always in a state of doubt. Traders know that the coming weeks will be crucial in determining Bitcoin’s trajectory.
Although the strength of the bull run is approaching, the risk of further volatility and correction remains, making it an important time for those invested in this volatile asset. The interplay between historical patterns and current market forces will shape the fate of BTC in the near future.
Important Need for BTC Test
Bitcoin is trading at $61,350 after facing resistance at the 4-hour 200 exponential moving average (EMA) at $61,645. The price remains above the 4-hour moving average (MA) at $60,363, an important level of support for bulls aiming to regain strength.
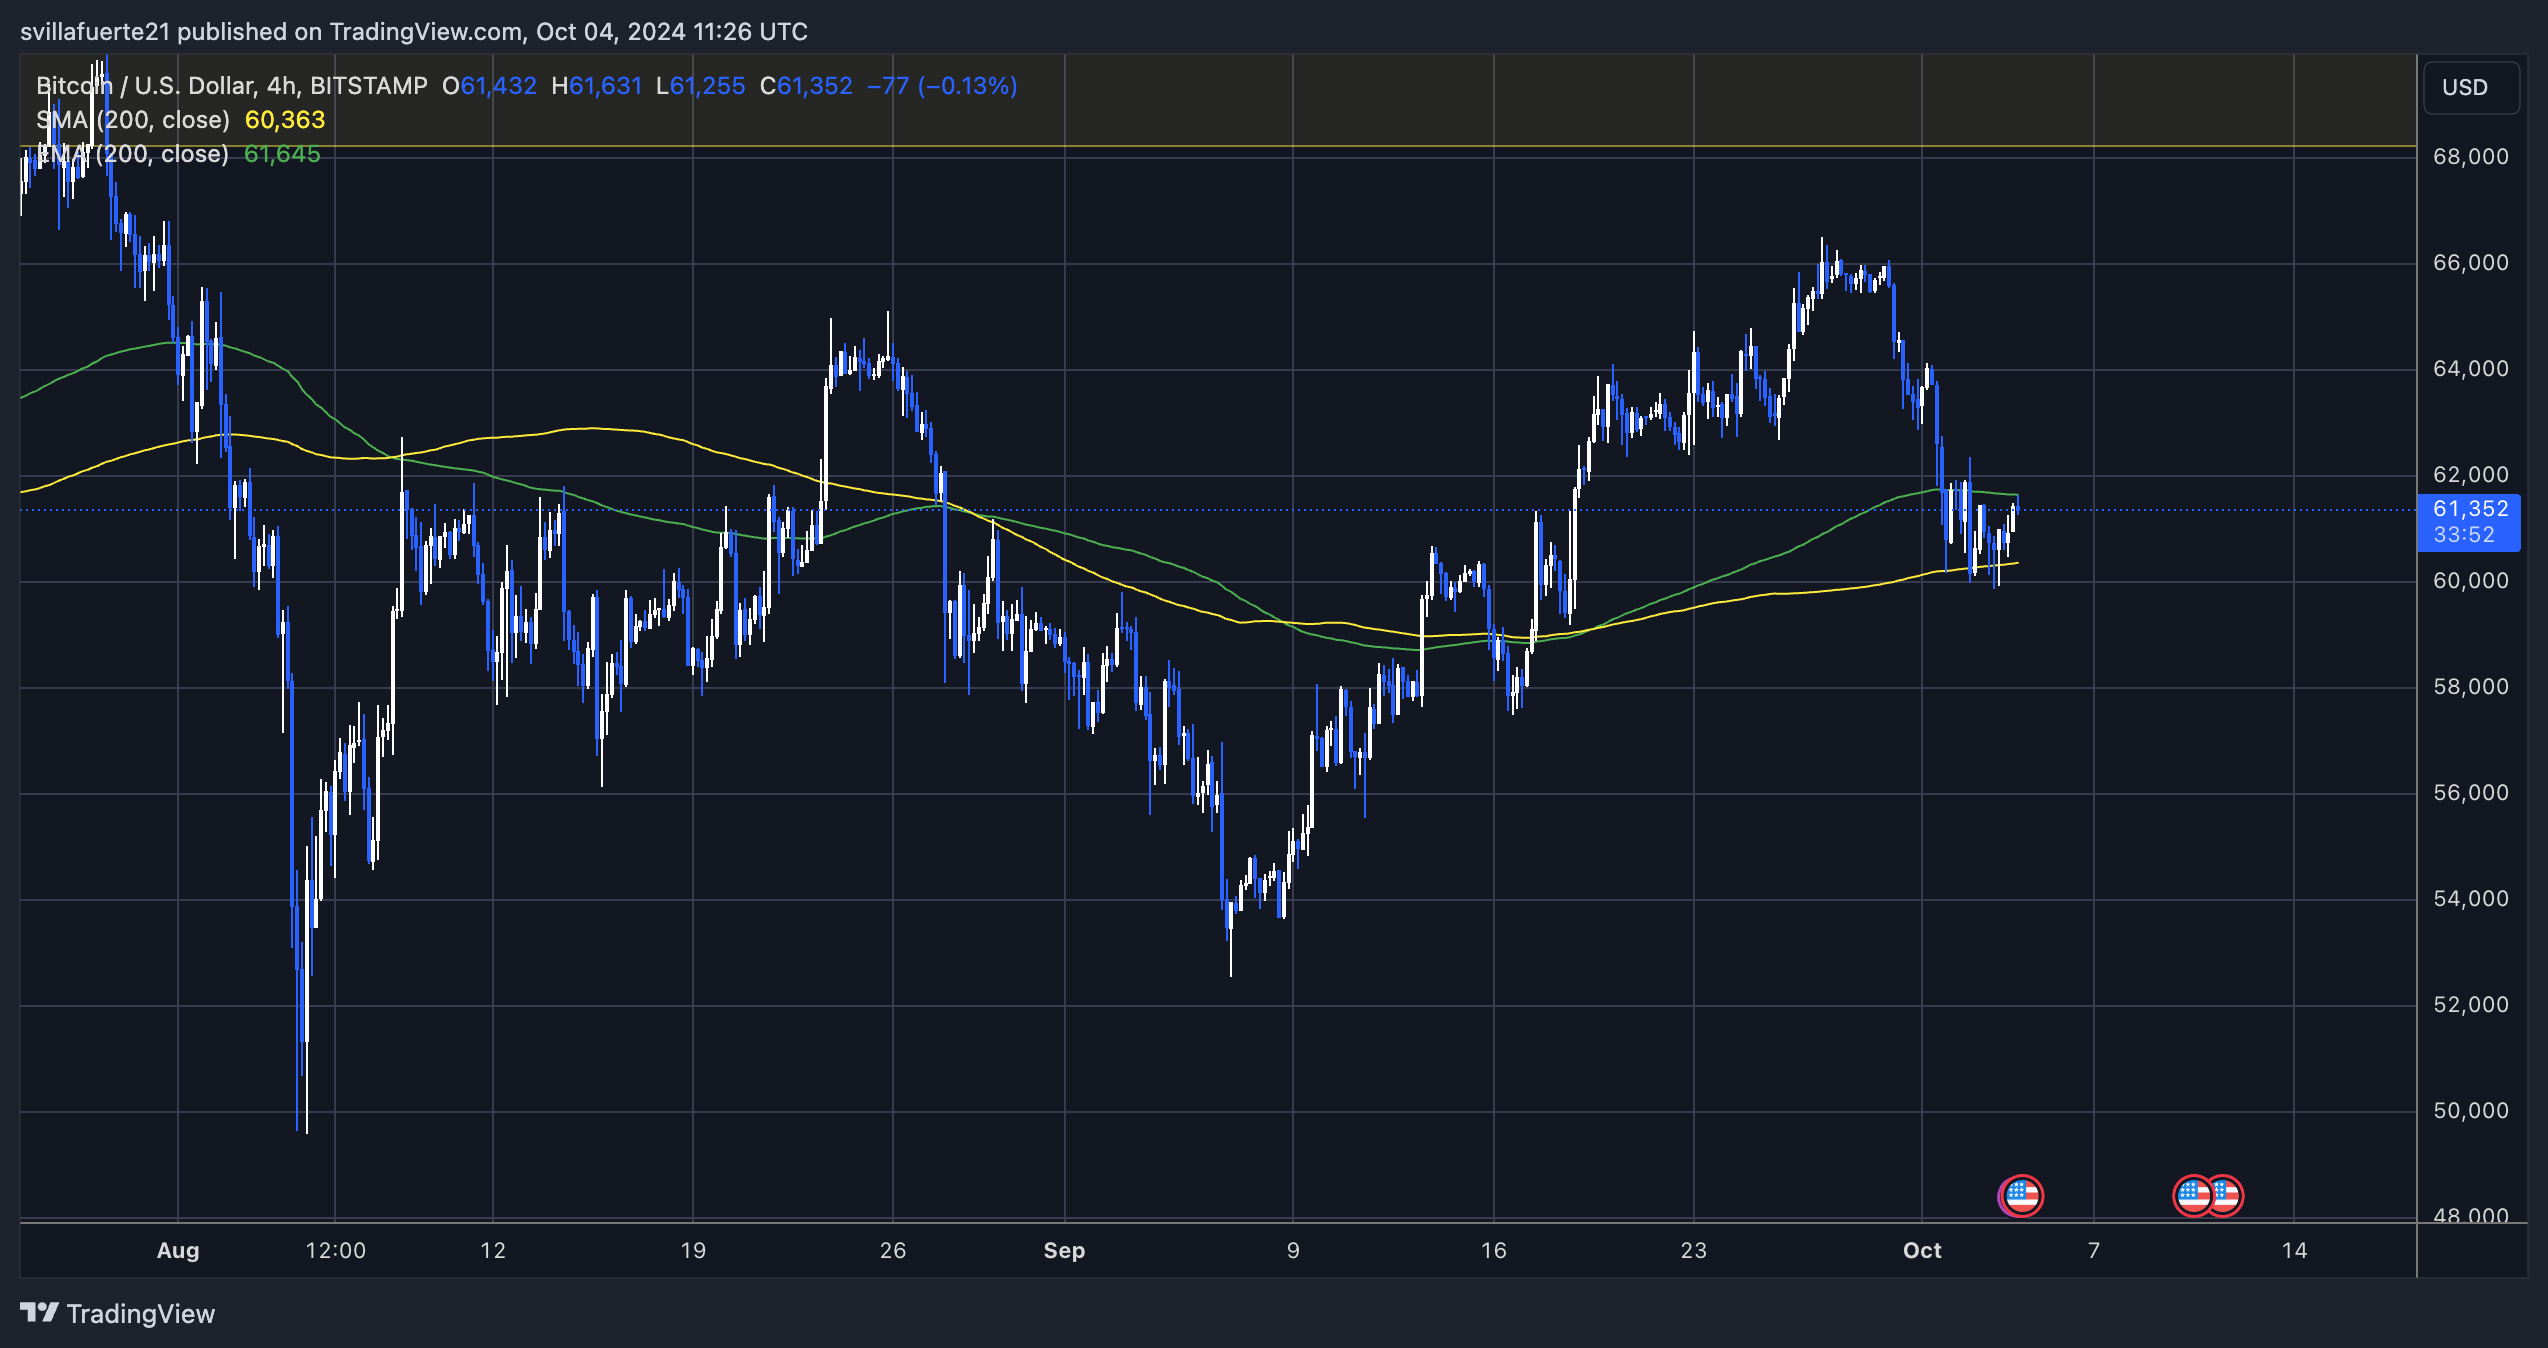
BTC should break above the EMA and test higher supply levels, especially around $66,000, in order to continue rising. If successful, this could indicate strong bullish momentum heading into the coming weeks.
However, a failure to hold above the 4,200 hour MA could lead to a deep correction, with potential targets around $57,500 or lower. Traders are closely monitoring these important indicators, as the current price action indicates a significant rally for Bitcoin.
The next few sessions will determine if the bulls can regain control or if the bearish trend will take hold. Investors should remain vigilant, as volatility may increase, impacting market sentiment and price direction. The synergy between these technical standards will be important for traders navigating the uncertainty of the crypto market.
Featured image from Dall-E, chart from TradingView
Source link