Bitcoin sentiment has taken a sharp turn, going from optimism above the $100K mark to growing pessimism as the price hovers around $95K. The much-anticipated clean breakout after retrieving the $100K level failed to materialize, leaving investors questioning the strength of the current bull trend.
Senior analyst Axel Adler shared insightful data on X, revealing a significant change in profitability metrics available in the market. Average daily revenue has dropped from $136M to $93M, indicating a cooling phase. Despite this decline, realized profit levels remain comparable to the peaks of the 2021 cycle, highlighting the continued strength and activity in the market.
This data underlines the duality of the current situation: while Bitcoin still shows signs of resilience, the failure to sustain momentum above the $100K mark has brought uncertainty to the market. Analysts and investors are now closely watching the $95K level, an important support area that can determine whether Bitcoin regains its bullish path or faces a deep correction. The coming days will be crucial as the market seeks clarity and direction on this important stage.
Bitcoin Metrics Set Market Picture
Bitcoin’s current phase is consolidation, a common behavior after breaking important psychological and technical levels. As Bitcoin first crossed the $100K mark on December 5, the price reached an all-time high of around $108K before consolidating further below the $100K mark. This period of sideways action presented mixed emotions, with bulls eager for another leg up and bears eyeing a potential correction.
Analyst Axel Adler shared critical insights on X, highlighting a drop in average revenue volume from $136M/day to $93M/day. Despite this decrease, Adler points out that these figures are still comparable to the peak of the 2021 cycle, indicating strong market performance. Historical data reinforces this view, as September 2021 and 2024 both saw mini-bullish rallies begin when average daily earnings were around $15M—half of current levels.
It is important to note that Adler’s analysis relies on 30-day moving averages, which adjust for short-term fluctuations but also mean that the actual profit realized is much higher. For example, on November 21, 2024, one month after the rally started at $98K, the daily profit of investors increased to $443M.
These metrics suggest that while Bitcoin is rallying, the underlying market activity remains strong, setting the stage for a possible bullish continuation. If BTC holds key levels, another test move or a break from recent highs may be on the horizon.
BTC Technical View: Key Levels to Catch
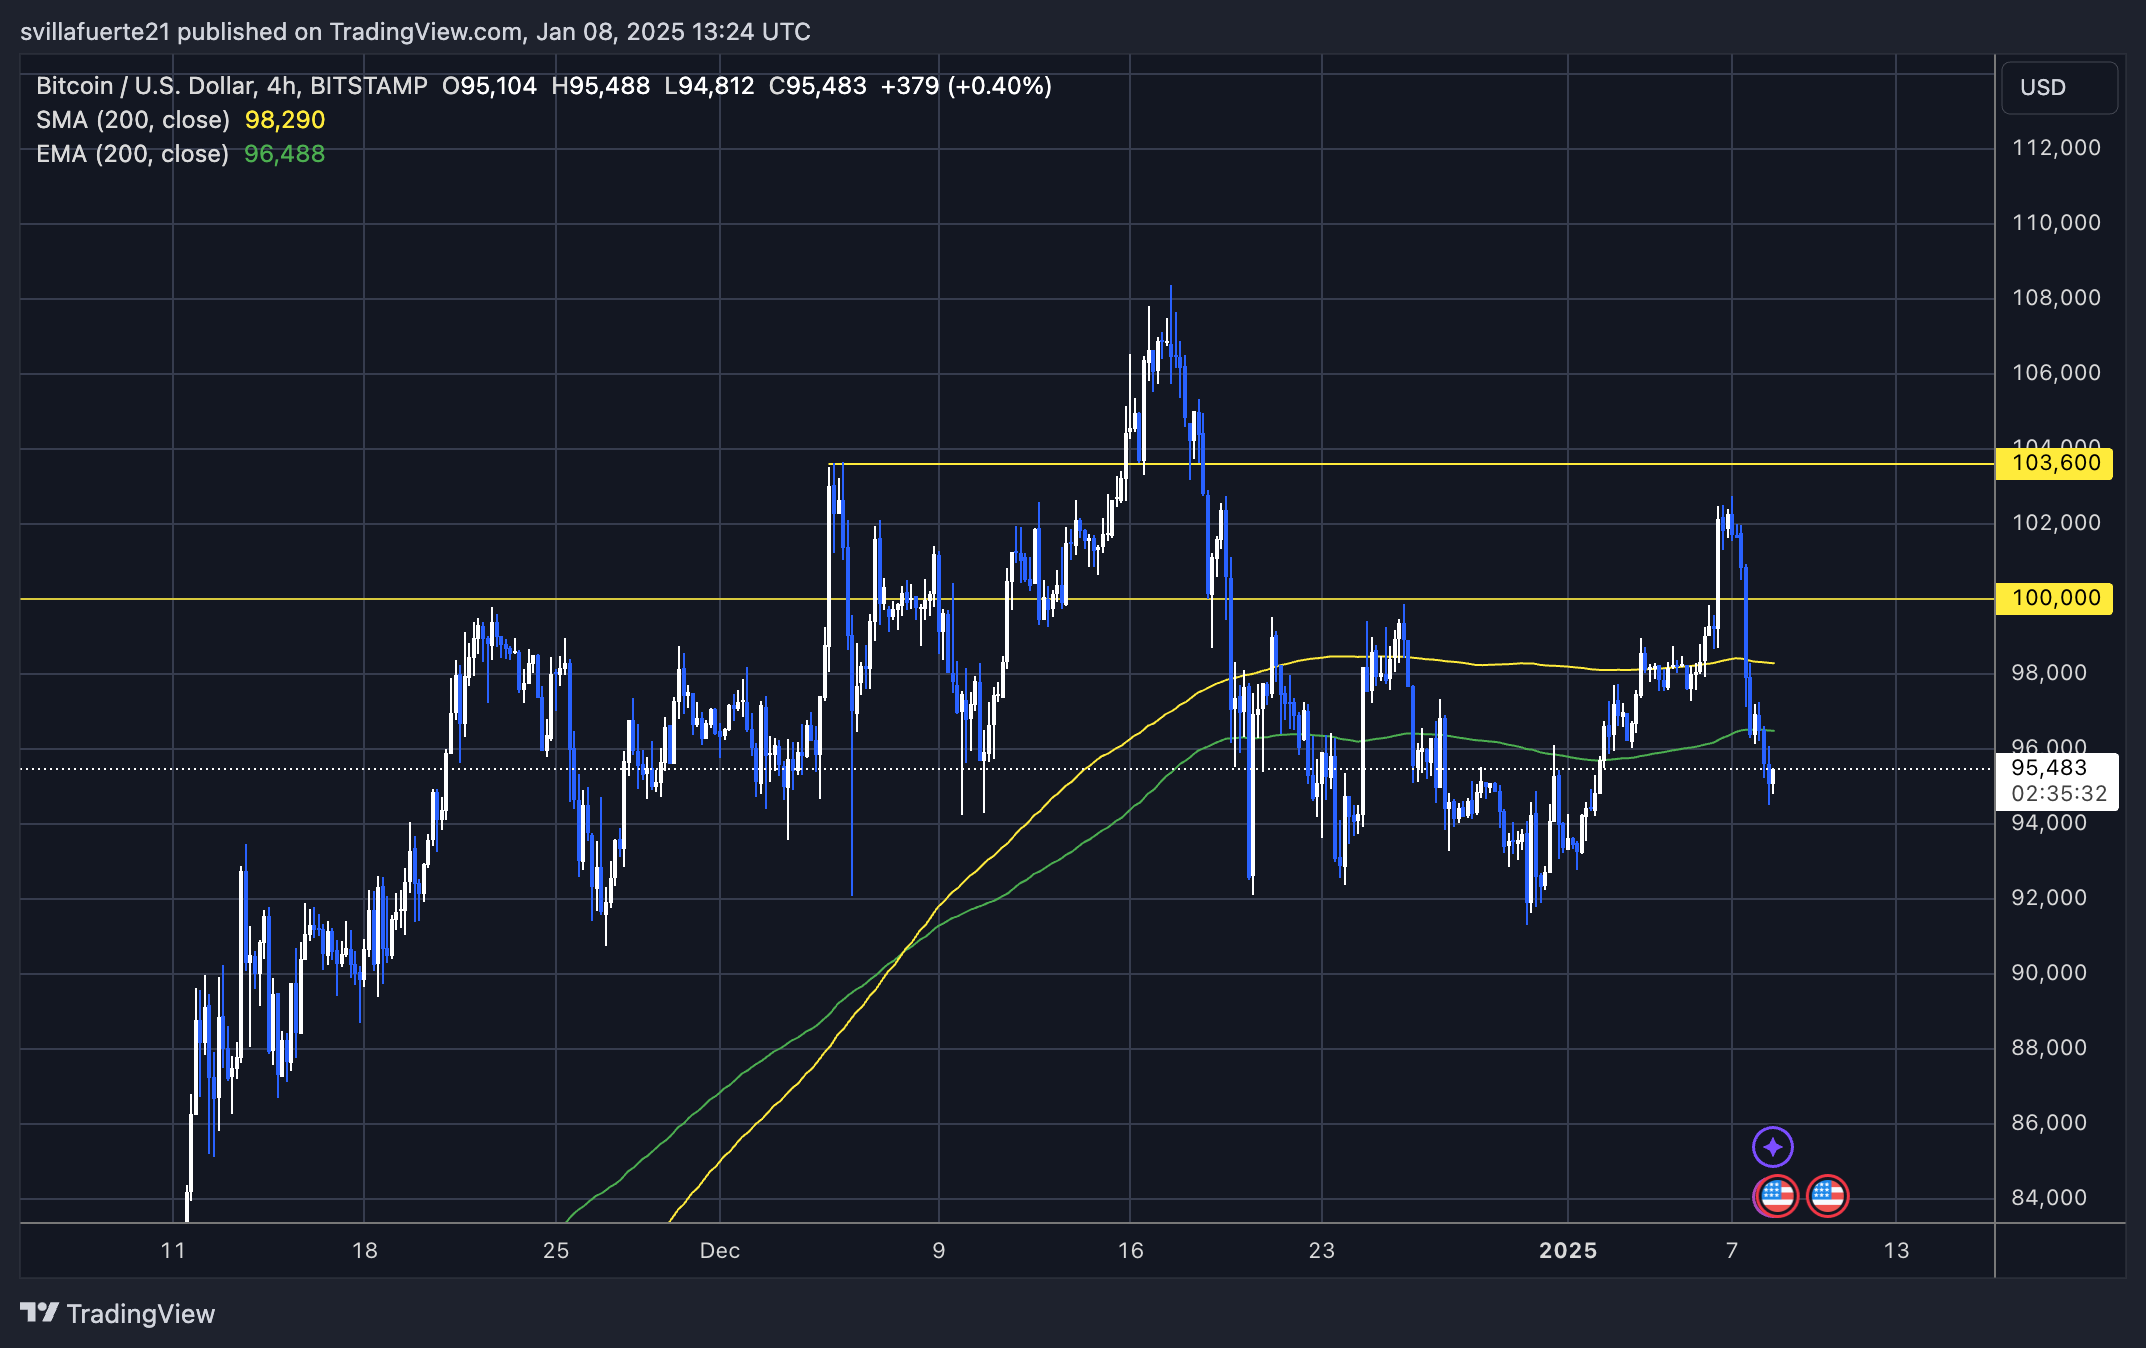
Bitcoin is trading at $95,400 after missing key levels, including the $100K psychological mark, the 4-hour 200 MA at $98,290, and the EMA at $96,480. This series of breaks indicates short-term bearish price action, raising concerns among investors about the possibility of a further decline.
However, despite this aggressive selling pressure, some analysts suggest that this could be a cash-generating step ahead of another push higher. This type of volatility is not uncommon during consolidation near critical levels, especially after a significant rally like the one experienced by Bitcoin in December.
The $95K mark now serves as a key support area for the bulls. If BTC is able to hold this level in the coming hours, it could signal the end of this bearish phase and set the stage for an immediate recovery. Retrieving the $96,480 EMA would be an encouraging first step, while a move above the $98,290 4-hour 200 MA would confirm the return of bullish momentum.
Market participants are closely monitoring these levels, as a sustained hold above $95K could revive confidence and return Bitcoin to its upward trajectory. However, failure to maintain this support can lead to deep corrections in the short term.
Featured image from Dall-E, chart from TradingView
Source link