This article is also available in Spanish.
In a technical analysis shared on X, popular crypto analyst Ali Martinez (@ali_charts) drew attention to a potential bullish signal for XRP. Martinez emphasized that the SuperTrend indicator, used on the 12-hour chart of XRP/USDT, has switched to a bullish orientation—the pattern that preceded the last meteoric 470% price increase.
“The last time the SuperTrend indicator turned bullish on the 12-hour chart, XRP was up 470%… It reversed again,” wrote Martinez on X and shared the chart below.
What This Means for XRP Price
The SuperTrend indicator is a popular trend-following technical analysis tool created by Olivier Seban. It overlays on price charts and helps traders identify the prevailing market trend by dynamically adjusting based on volatility. The indicator primarily uses the Average True Range (ATR) to determine its position in relation to price movements, providing clear buy and sell signals.
Related Reading
SuperTrend is calculated using ATR and a multiplier (usually set to 3). It plots the line above or below the price, changing its position when the price crosses these levels. A bullish flip occurs when the indicator moves below the price, indicating a possible upside. Conversely, a bearish flip occurs when it moves above the price, indicating a possible downside.
Martinez referred to the last time the SuperTrend indicator turned bullish on XRP’s 12-hour chart, which then led to a staggering 470% price increase. The last bullish flip happened in November of last year, when XRP was trading around $0.50. After the reversal, XRP entered a strong rally, breaking through key resistance levels and reaching a high of $2.90 on December 3, representing a 470% gain from its previous count.
Related Reading
According to Martinez, the SuperTrend indicator on the 12-hour chart has turned bullish again. This revival suggests a possible repetition of previous bursts of upward movement. Notably, the bullish SuperTrend corresponds to a bullish chart setup on the weekly chart.
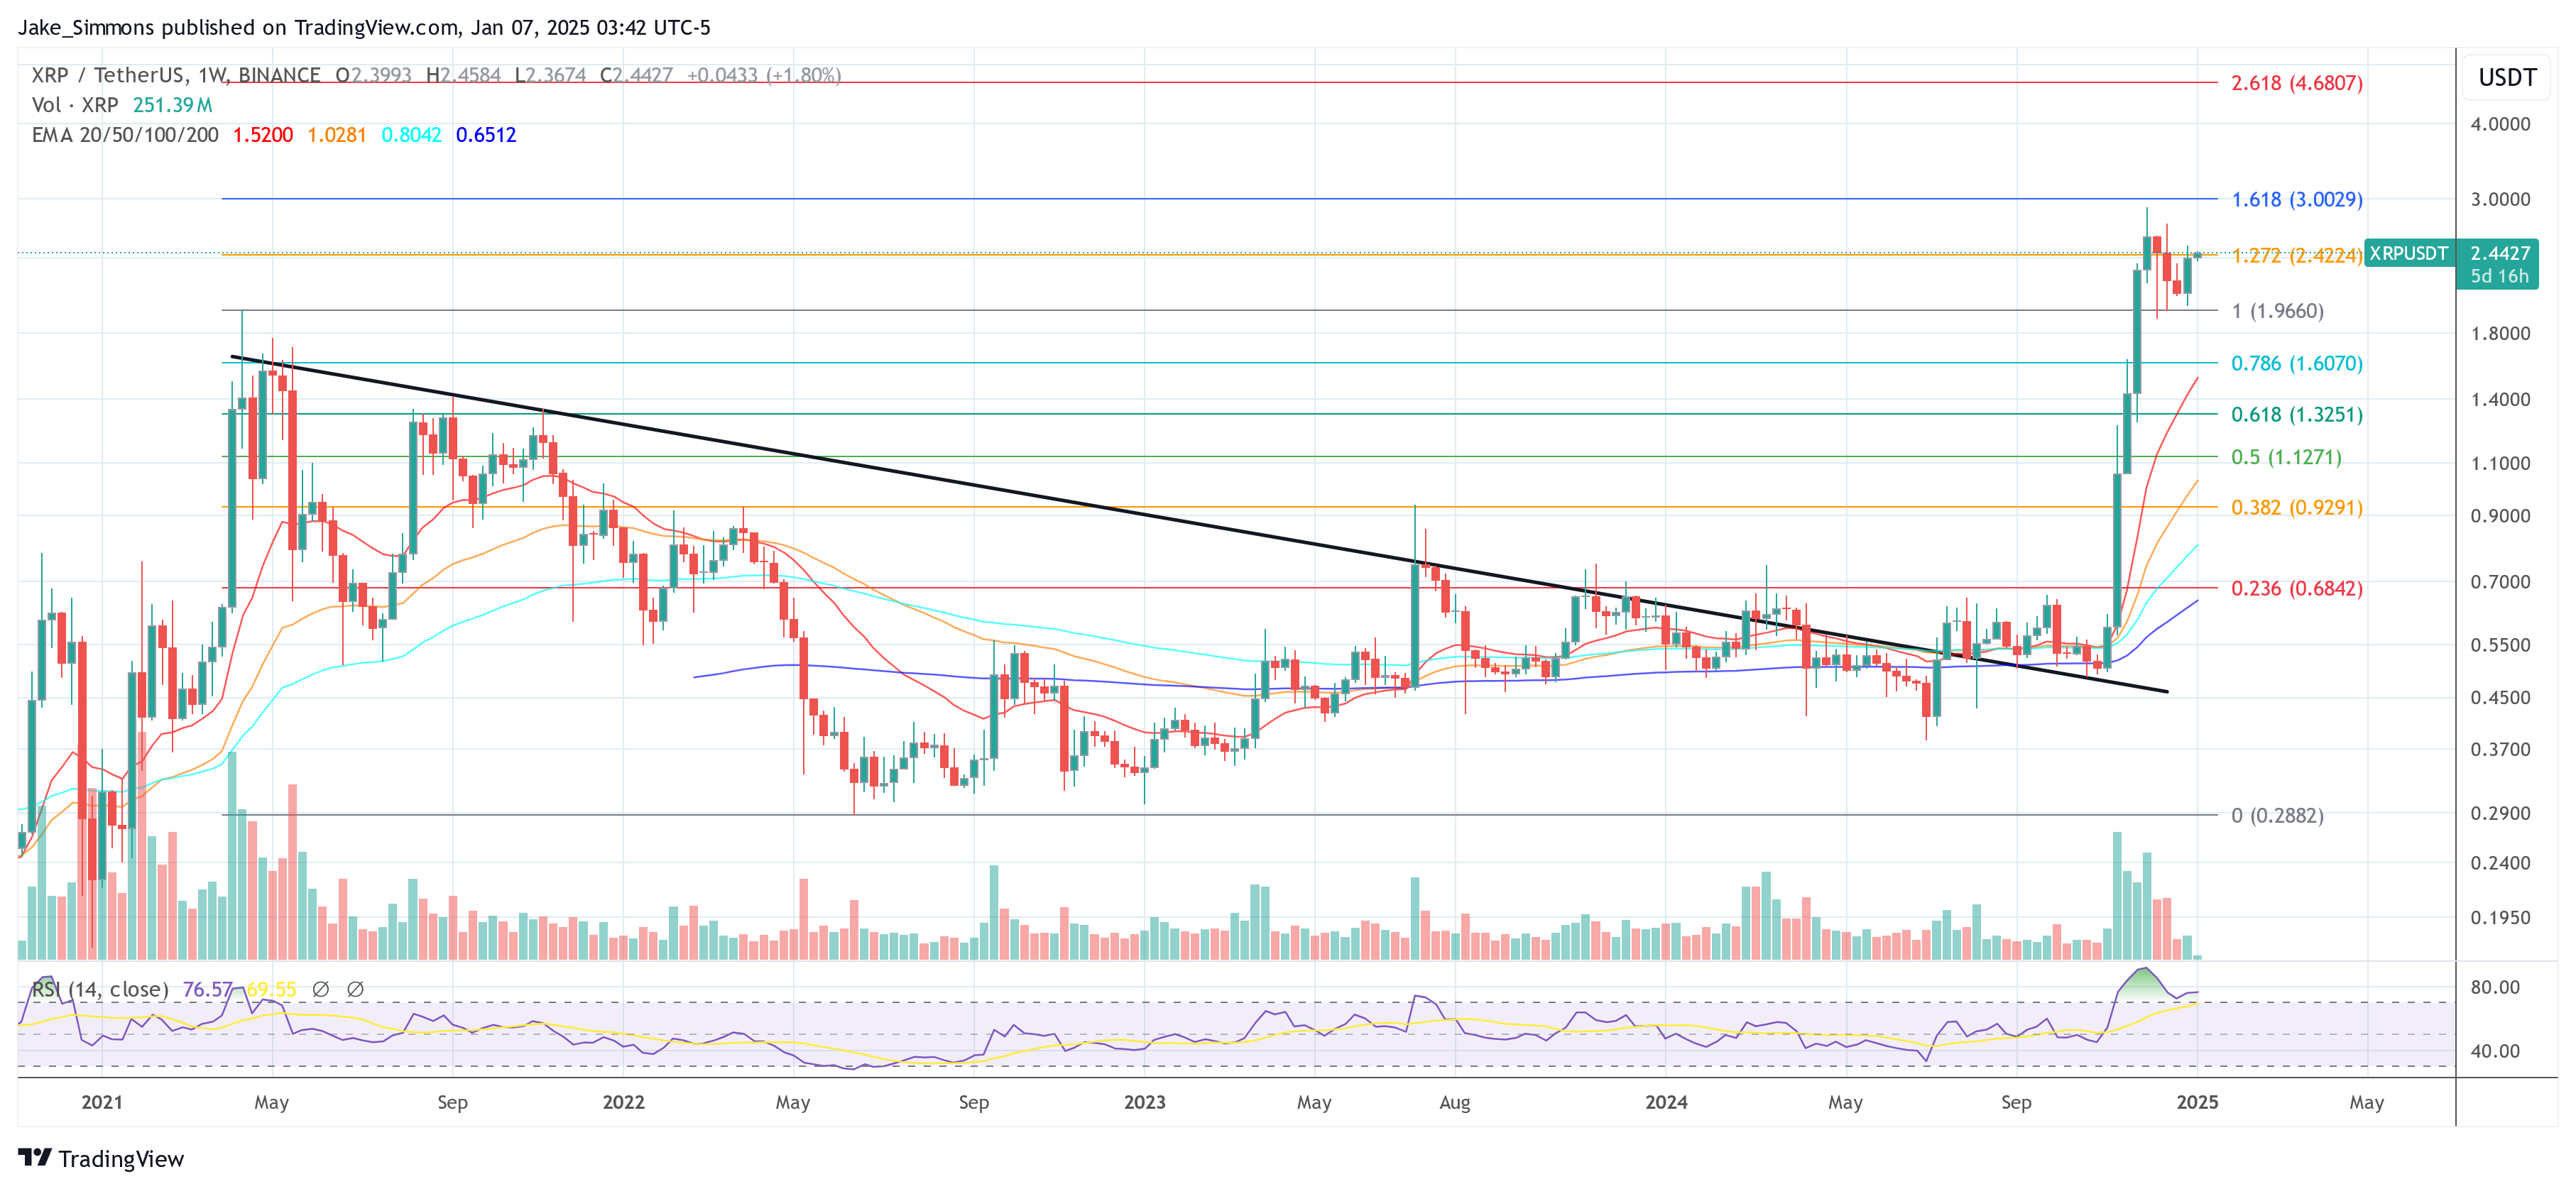
Last week, XRP released a key support at $1.96, and is now looking for a weekly close above the 1.272 Fibonacci extension level at $2.42. A decisive break above this resistance, combined with sustained volume, could propel the price towards the Fibonacci retracement level of 1.618 at $3.00.
Based on historical precedent, if XRP shows the previous pattern, the price target could be very high. A 470% increase would point to a price level of around $13.80.
At press time, XRP traded at $2.44.
The featured image was created with DALL.E, a chart from TradingView.com
Source link