Bitcoin finally broke the $100,000 barrier, reaching an all-time high of $103,600. The milestone marked a historic moment for the cryptocurrency as investors and enthusiasts celebrated its journey to six figures. However, the happiness was short-lived. Within hours, BTC experienced a sharp pullback, hitting $92,000 in a dramatic selloff that left the market reeling.
Senior analyst Axel Adler took to X to explain the sudden decline, pointing to a large number of senior positions as the main cause. According to Adler, as BTC passed $100K, a liquidation was initiated, leading to a rapid correction. Leverage, a double-edged sword in crypto markets, has increased downward pressure as heavily leveraged traders are forced to exit their positions.
Although the reversal rocked the market, BTC remains above key levels, with analysts debating its next move. Some believe this pullback is a healthy reset, paving the way for a more sustained rally. Others worry that it may signal further volatility. As BTC consolidates after this historic surge and sharp correction, all eyes are on whether it can regain the $100K level and hold it as support in the coming days.
Bitcoin Open Interest Shows Us Something
Bitcoin experienced one of its most volatile days of the cycle, going from $103K to $92K in less than 24 hours. This sharp reversal has left many investors wondering what caused such a big move after all the excitement surrounding the all-time new Bitcoin. According to important data from CryptoQuant analyst Axel Adler, the sharp drop may be caused by an important reduction event in the futures market.
Adler explained that the liquidation of long positions played an important role in lowering the price. As BTC passed $102K, many traders held very high positions, and when the market turned against them, the forced liquidation created a bearish effect.
This price cut brought the price back down from $102K to $90K, as traders rushed to close positions and cut their losses. Adler described this as a necessary “shake-up”, noting that the market has been going too well for the bulls, leading to a correction in nature.
As BTC is now trading low, the next few days will be crucial in determining its direction. Although the correction may be seen as a healthy reversal, there is a risk that this may mark a high point for BTC, especially if it fails to recover important levels like $100K.
Investors and analysts are watching closely to see if BTC can stabilize above these levels or if there is more downside to come. Volatility and rapid price swings highlight the risks inherent in BTC trading, especially during this period of high volatility.
Indecision Hitting The Market
Bitcoin is currently trading at $98,000 after yesterday’s volatile price action, where it rose to a new all-time high before retracement. The market is now facing indecision as the bulls continue to drive the price above recent highs, while the bears believe it may be time for a correction. This tension between buyers and sellers creates uncertainty in the short term.
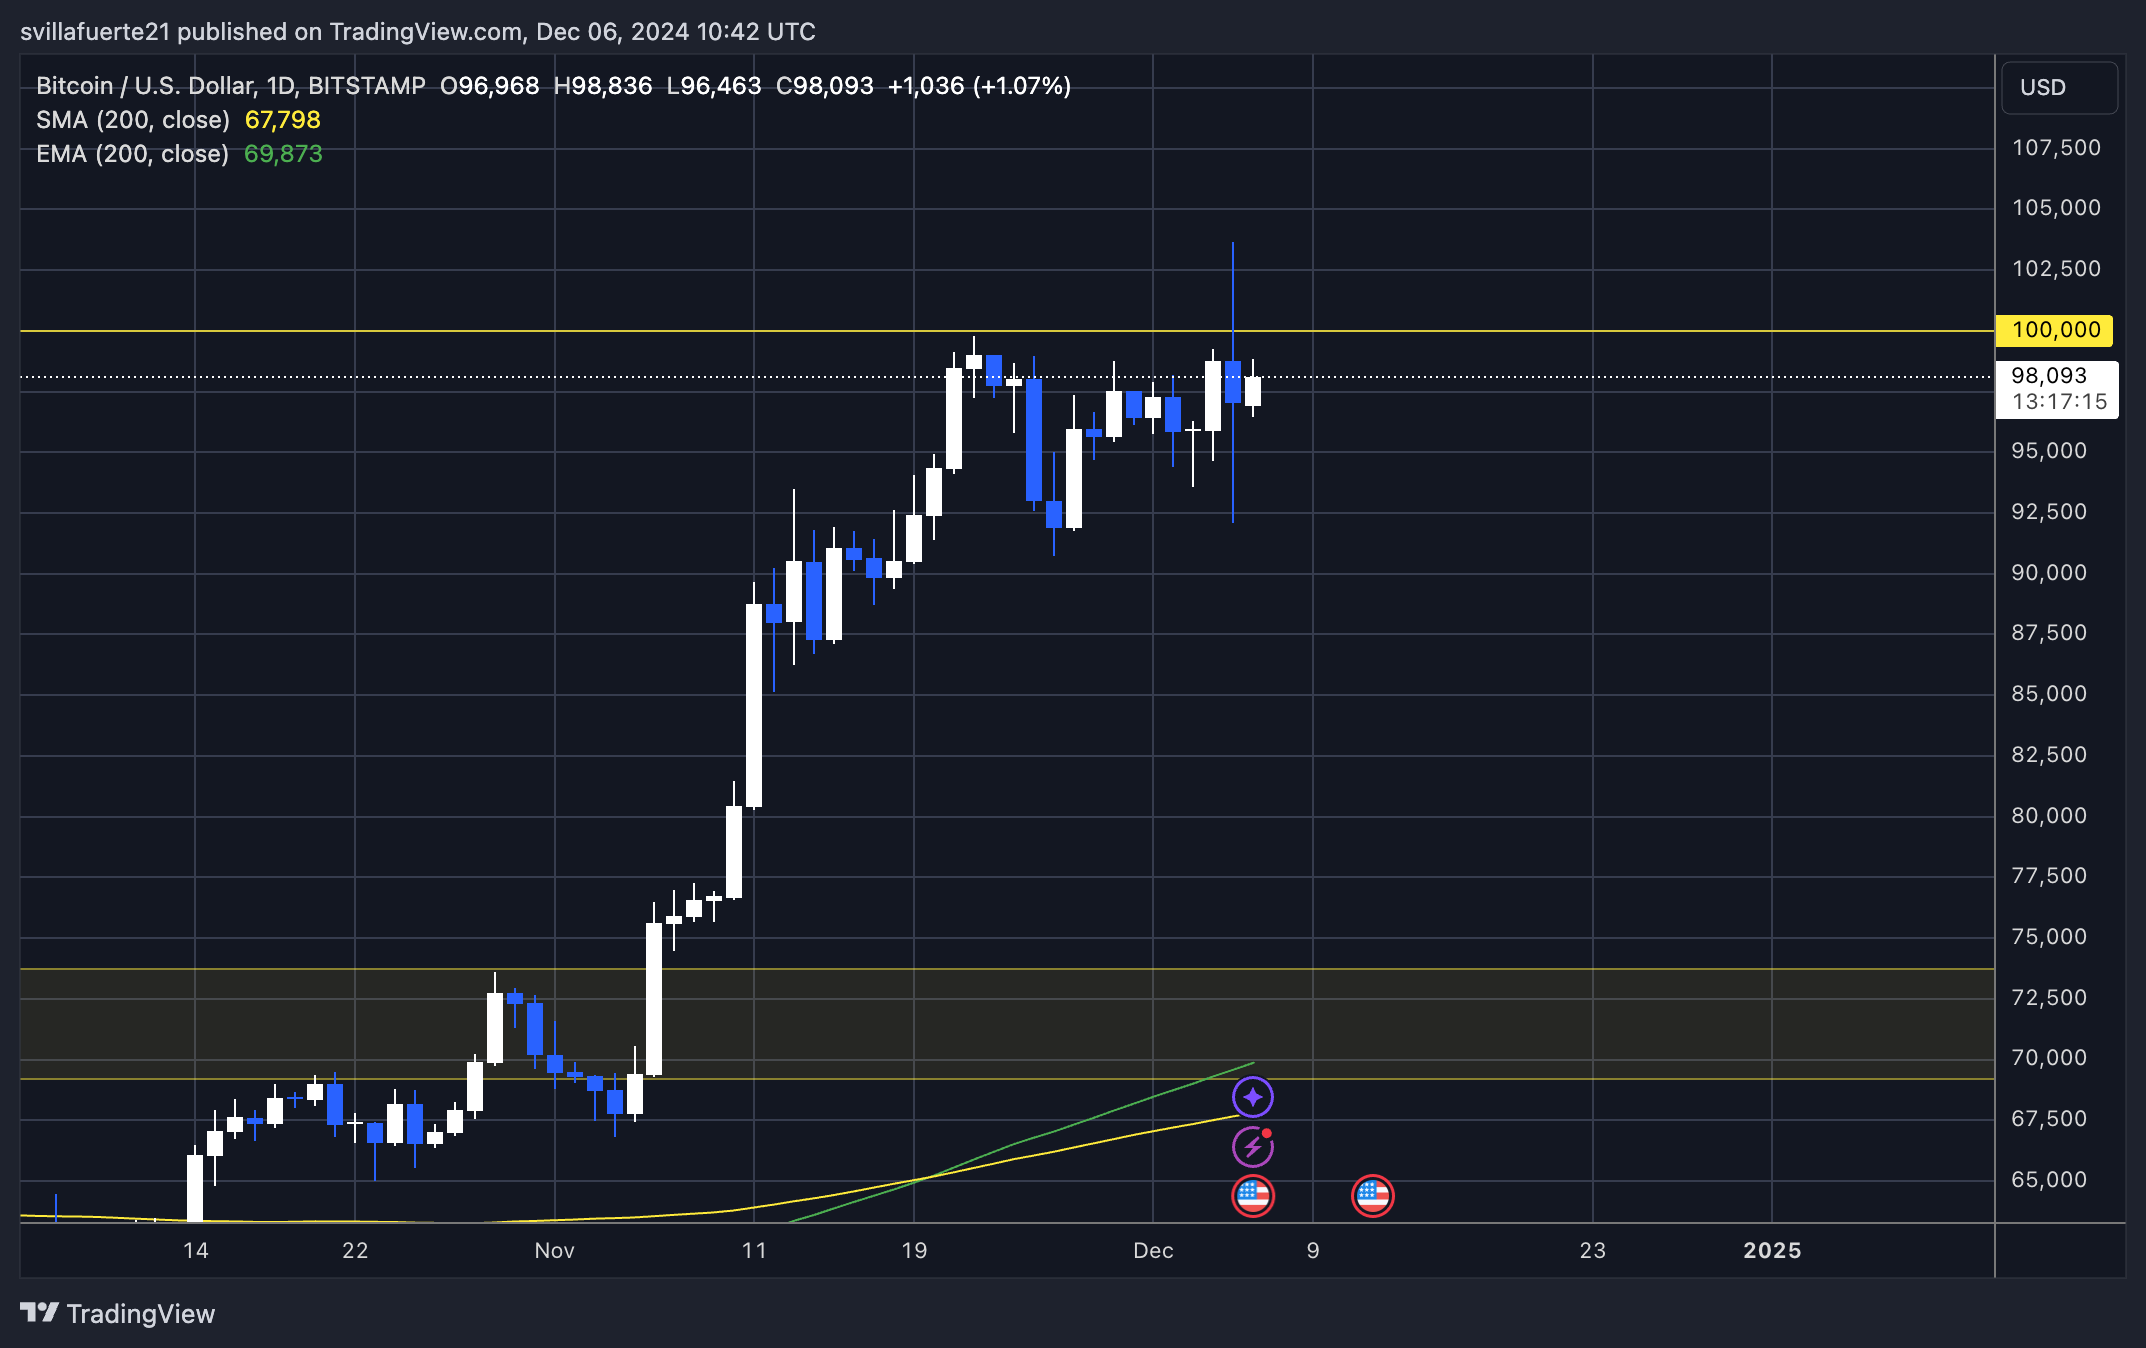
For Bitcoin to confirm the continuation of its bullish trend, it needs to hold above the important $95,000 mark in the coming days. If this support level holds, BTC will likely retest its all-time high of $103,600, as bullish momentum remains intact. A successful break above this level could pave the way for an even higher price.
However, if Bitcoin fails to hold above $95,000, it may indicate a change in market sentiment, leading to a possible correction. A loss of support at this level would suggest that the bears are taking control, and the price may bounce back. The next few days will be crucial in determining whether BTC can continue its rally or if the market will enter a consolidation or bearish period. Investors will be watching this price action closely for signs of a clear direction.
Featured image from Dall-E, chart from TradingView
Source link