Bitcoin is on a record-breaking mission, hitting all-time highs for three consecutive days following Donald Trump’s US election victory and a 25 basis point cut by the Federal Reserve. This combination of political and economic changes has fueled a renewed wave of investor interest in BTC, driving prices into uncharted territory.
Top crypto analyst and investor Daan shared an optimistic view, highlighting that BTC is now in a price-recovery mode that could have a significant upside to the $88,800 mark.
As Bitcoin meets new highs, the current bull trend appears to be in its early stages. Analysts and investors are closely watching BTC’s price action, with many expecting strong momentum as institutional demand grows. With significant macroeconomic volatility favoring other assets, BTC is uniquely positioned to benefit, and is supported by rising prices and growing demand in the US markets.
The next few weeks will be crucial as Bitcoin tests new price levels and traders gauge how far this bull can go. As BTC enters price recovery, breaking previous resistance levels, the stage is set for a potentially transformative period, fueling optimism for both seasoned investors and newcomers to the crypto space.
Bitcoin Enters Price Recovery
Bitcoin has entered a new bullish phase, marking the beginning of a price recovery period after three consecutive days of continuously breaking all-time highs. This move set a bullish tone not just for BTC but for the entire crypto market. As BTC pushes higher, it solidifies its position as the market leader, driving optimism and interest in altcoins.
Top analyst Daan recently shared a technical analysis on X, suggesting that the next target for Bitcoin in the price recovery phase is $88,888. He stressed that although Bitcoin is unlikely to reach this target in a direct way, the main trend remains bullish, and the market has been waiting for this explosion for eight months. Daan warned that the journey to these higher levels will be difficult, and volatility is expected as the market works through this new phase.
The coming months are likely to see more volatility as Bitcoin tests new resistance levels and investors digest the results of the broader bull market. However, the fundamental outlook is very positive, fueled by strong demand from institutional investors and continued macroeconomic support.
As Bitcoin breaks through key price barriers, it will continue to drive the narrative of the entire crypto market, with many analysts predicting more if the current momentum is maintained. The road ahead may be volatile, but the long-term outlook remains very strong for Bitcoin.
BTC Testing Uncharted Territory
Bitcoin is currently covering the $76,400 mark after a strong surge last week, with the bulls firmly in control. The price managed to break above the previous high, pushing past the key resistance at $73,800. This level is now important, as it could become a very sought-after property following its breakout. If BTC is able to stay above $73,800 in the coming days, it will show a bullish continuation, which may drive the price higher.
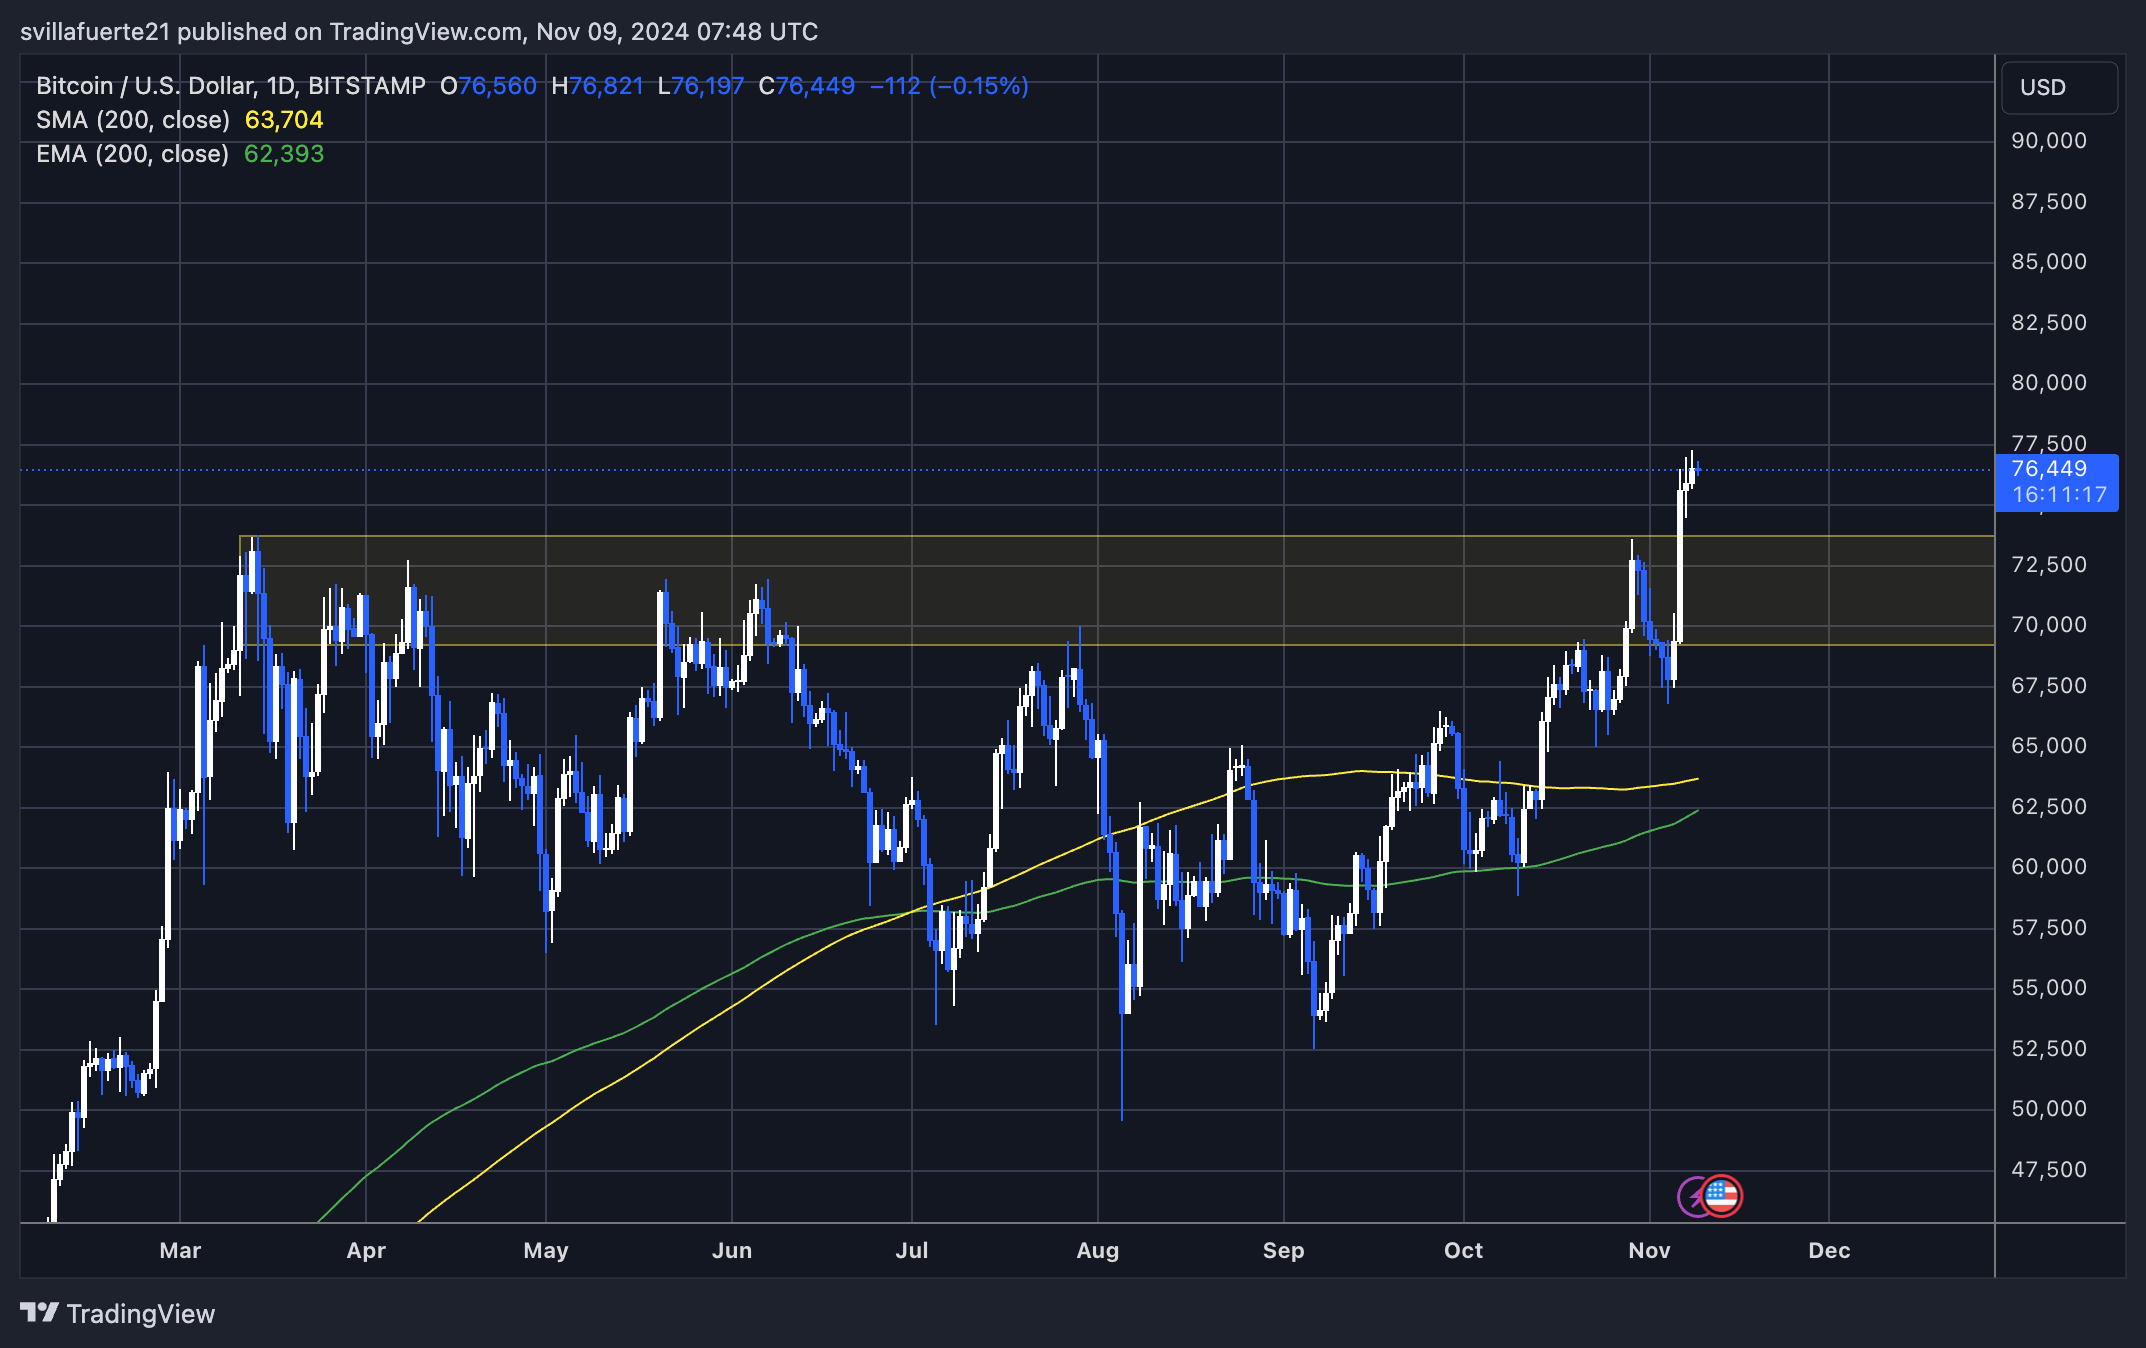
However, if BTC struggles to break above the $77,000 mark, a healthy follow-up to the lower demand levels around $72,500 is possible. This pullback will allow the market to find support before pushing higher. The recovery will provide a much-needed reset to the market, remove weak spots and allow for sustainable growth.
In the short term, the $73,800 level is important to maintain bullish sentiment. If BTC holds above this area, it is likely to continue its upward trend. But, if the price fails to maintain this support, traders will be looking for signs of a deeper correction. Overall, market sentiment remains positive, and Bitcoin has the potential to continue its bullish trajectory if key levels hold.
Featured image from Dall-E, chart from TradingView
Source link