This article is also available in Spanish.
Solana (SOL) has been experiencing significant volatility and choppy price action since Monday, testing a key supply level that will determine where it heads in the coming weeks. As the market continues to rise, many analysts and investors are expecting a possible increase in SOL, especially with the resistance level of $160 which seems to be weakening under the recently increased pressure.
The crypto community has been watching these changes closely, as crossing this key resistance can lead to huge gains for the altcoin.
Related Reading
Senior analyst and investor Carl Runefelt recently shared a technical analysis that paints an optimistic picture for Solana’s price action over the next few hours. According to Runefelt, weak resistance could pave the way for an exit, with bullish momentum carrying SOL to higher targets.
Although the market remains volatile, confidence in Solana’s ability to overcome current challenges is growing. If the supply level is breached, it can mark the start of a new uptrend, making SOL a focal point for traders looking for opportunities in the current market environment.
The next few days will be crucial in shaping Solana’s trajectory, as investors will be closely monitoring whether the price will confirm the expected rally.
Solana Bullish Pattern Signals Momentum
The entire crypto market faces high volatility, and Solana was not immune to it, with its price fluctuating between $148 and $160 since Monday. This phase of consolidation has left traders eager to see what direction the altcoin will take in the coming days.
Runefelt recently shared a technical analysis on X, highlighting that Solana is breaking out of a 1-hour Falling Wedge pattern, a bullish signal.
The immediate target is $159.6, a level that, if broken and sustained, could lead to a major rally to $185—a significant move that would put Solana near its annual high.
Despite this bullish setup, the market remains cautious, and there is still a risk that Solana could fail to recover key levels. If the price struggles to break and hold above the $159.6 resistance, the current consolidation could continue or lead to a possible pullback, targeting the bottom near $148. Such a situation would discourage bulls looking for a rally and could dampen market sentiment for a while.
Related Reading
A confirmed breakout and sustained momentum may signal the start of a new bullish phase, attracting both retail and institutional investors.
However, the risk of exit failure is increasing, which keeps market participants on edge. Traders are watching to see if Solana’s next move will set the tone for its performance in the coming weeks. If it breaks through resistance, SOL could be on its way to perennial challenger.
Technical Levels to Watch
Solana is currently trading at $154 after finding support at the 200-day moving average (MA) at $150.7, a critical level that shows long-term strength if it holds as a search area. This MA has historically served as a key indicator of market trends, and holding above will strengthen the SOL outlook.
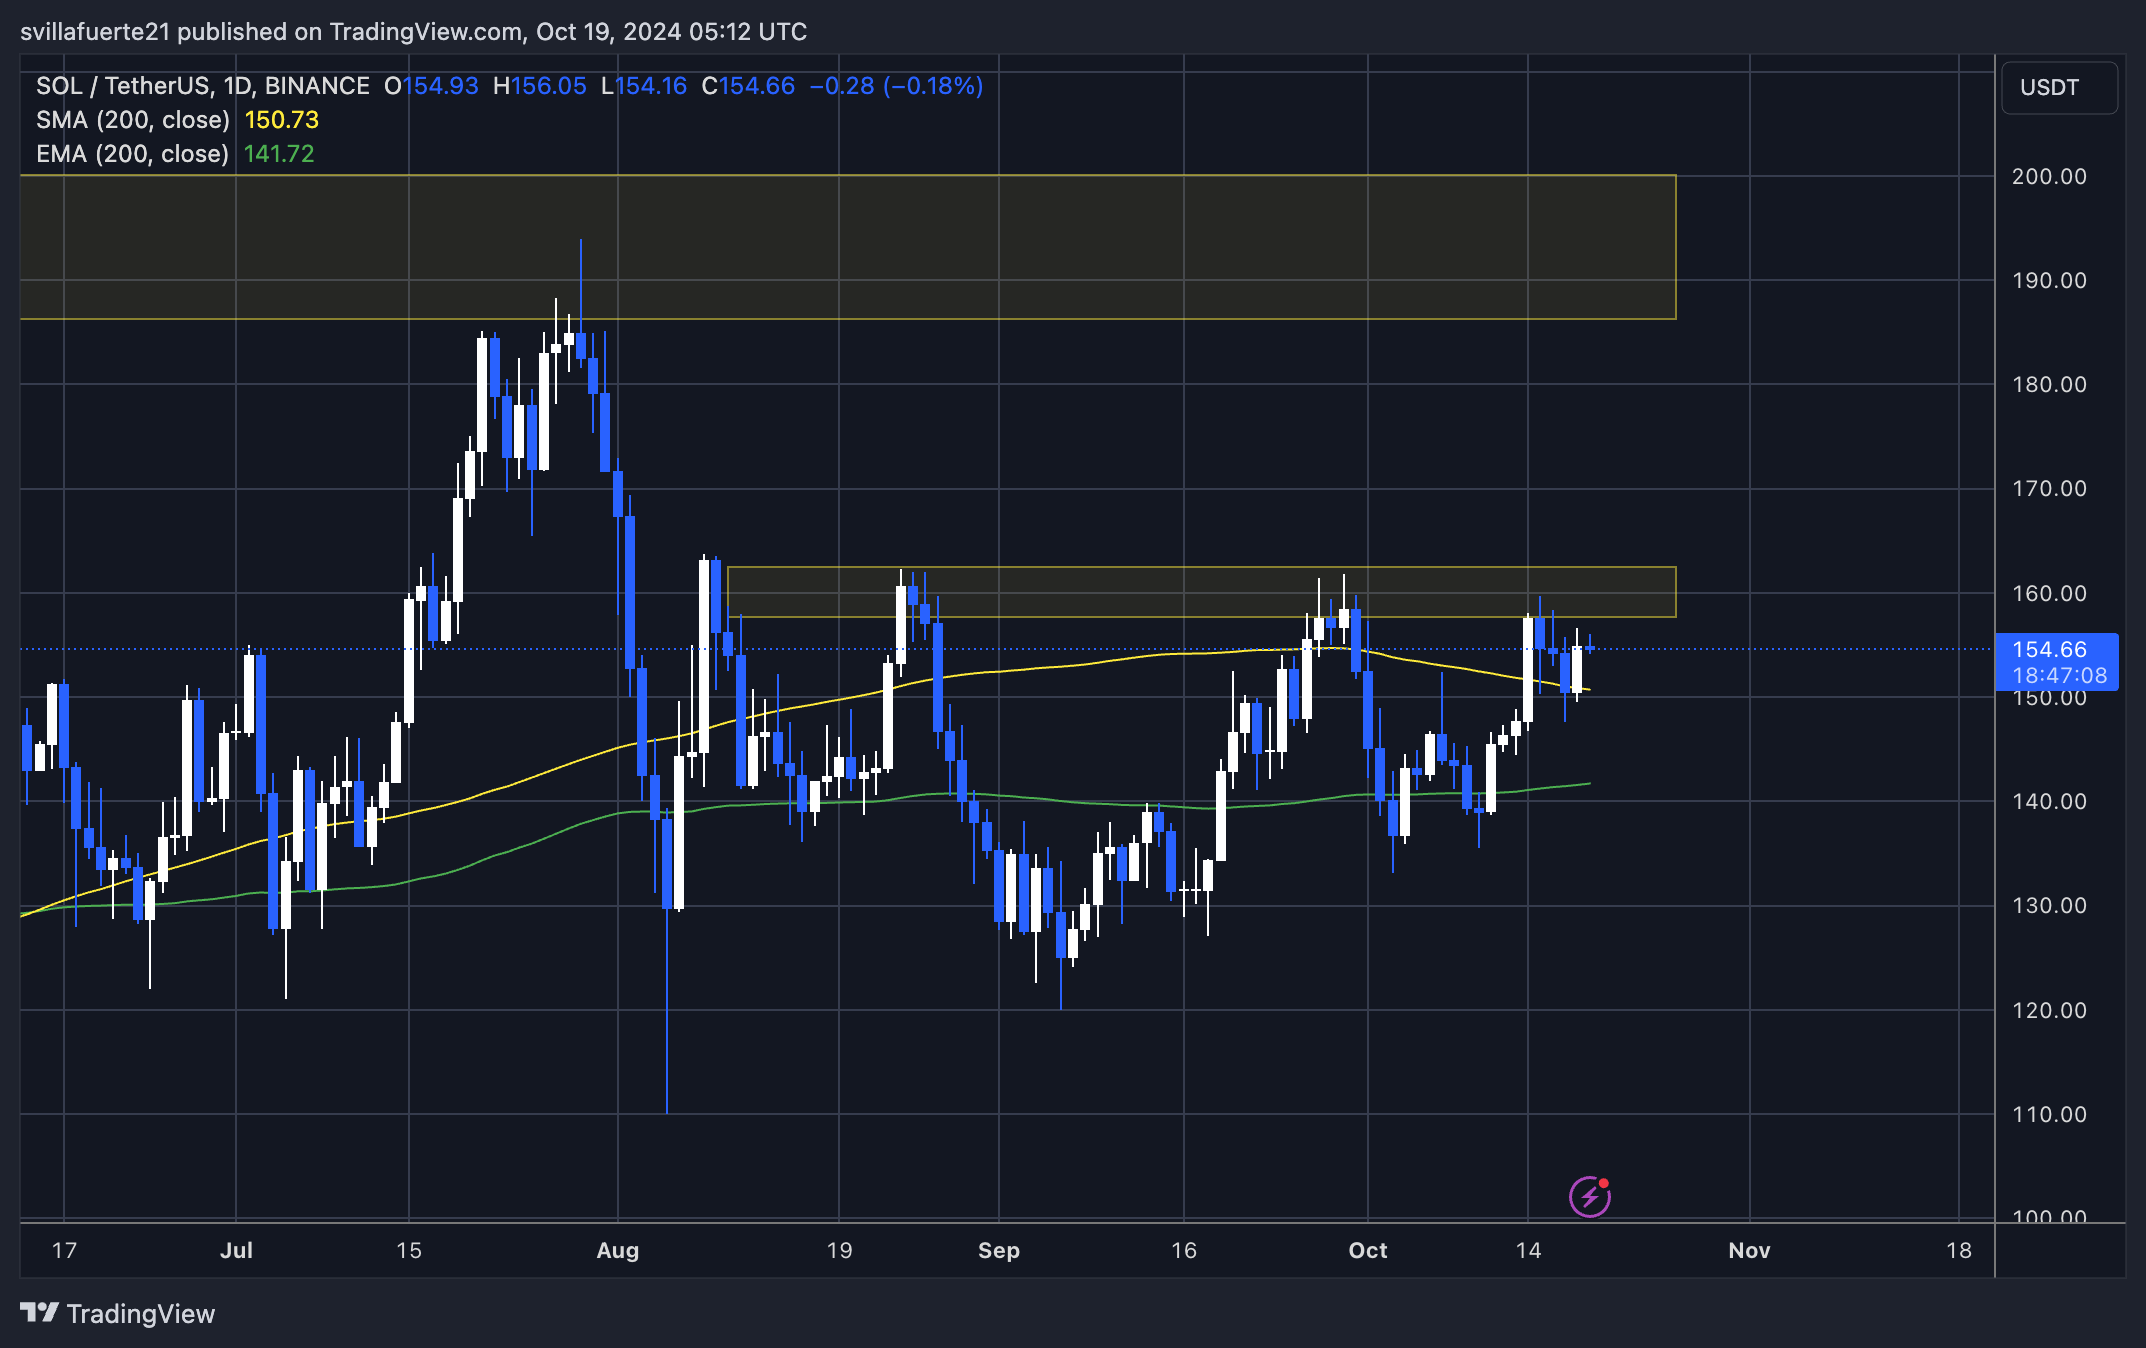
For the bulls to maintain the momentum, the price must stay above the 200-day MA and push to break through the key resistance of $160, the level that has held Solana’s upside since early August. A break above this resistance would indicate a potential price increase, opening the door to further gains in the coming weeks.
However, if SOL fails to hold above the 200-day MA and cannot overcome the $160 resistance, it risks a corrective move. A drop below the 1D 200 MA could lead to a drop to $140, a level that will play an important role in determining the next phase of Solana’s price action.
Related Reading
Bulls and bears alike are keeping a close eye on these key levels, as the next move could set the tone for Solana’s near-term performance.
Featured image from Dall-E, chart from TradingView
Source link